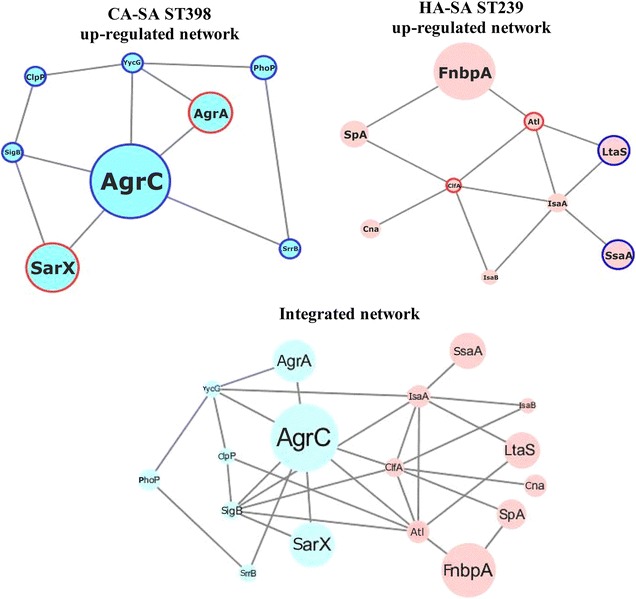
Fig. 3.

Cytoscape network reconstruction. Circle nodes represent genes. For the genes, the borders of the nodes represent the type of gene regulation determined by LC-MS/MS. The centers of the nodes indicate the gene expression changes; the diameter of the circle is proportional to the level of regulation. The blue outer circles of the nodes depict corresponding results from LC-MS/MS and qRT-PCR analyses (Fig. 4), and the red outer circles indicate corresponding results from LC-MS/MS and Western blot analysis (Fig. 5)
