Fig. 5.

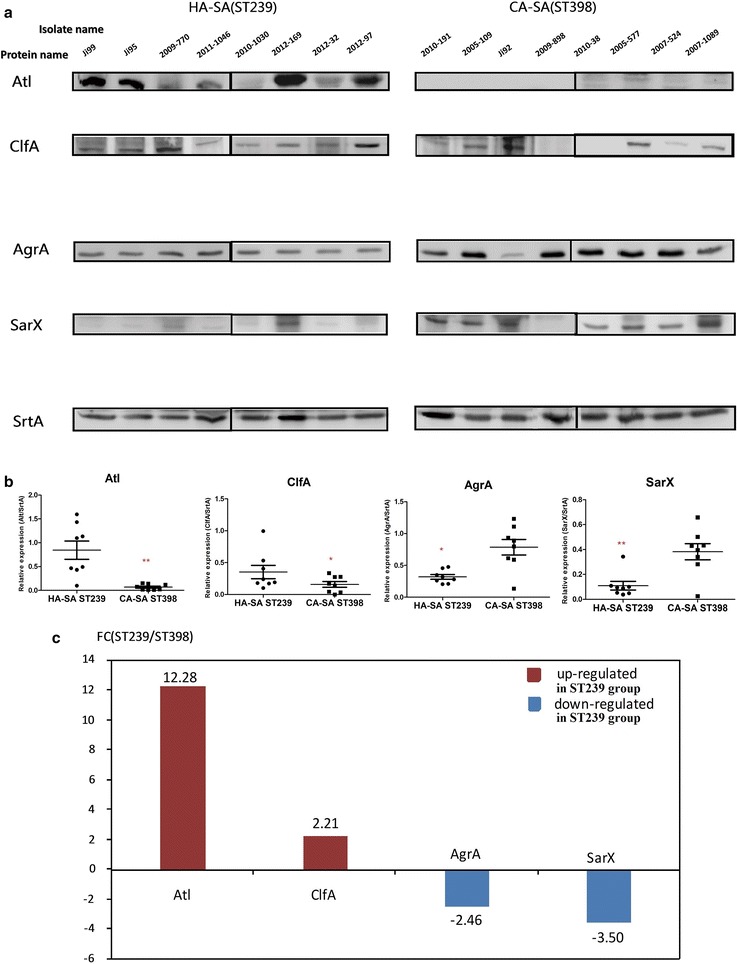
Western blot validation. a The expression levels of the four key differentially expressed proteins between HA-SA and CA-SA by densitometry of Western Blot in post-exponential phase cultures (8 h) using sortase A as control. b Densitometry plot of Western Blot. The values are normalized versus sortase A signals obtained using the same samples. *P < 0.05, **P < 0.01, ***P < 0.001 (unpaired t-test). c FC (ST239/ST398) in this figure shows the fold change of the average translationally expressed value of specific protein within HA-SA ST239 strains relative to that within CA-SA ST398 strains. Therefore, Down-regulated in ST239 group equivalents to Up-regulated in ST398 group
