
Fig. 4.
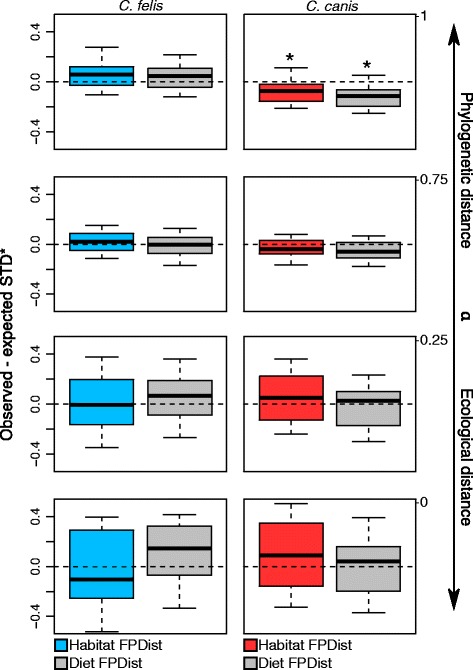
Differentials between observed and expected functional-phylogenetic host specificity (STD*) for dog fleas (Ctenocephalides canis; left panel) and cat fleas (C. felis; right panel) at varying α weights. Weighting values approaching 0 give more weight to host ecological distance, while values approaching 1 give higher weight to host phylogenetic distance. Negative differentials indicate infested hosts are more similar than expected by chance; positive values indicate infested hosts are more dissimilar than expected. Differentials were generated from 10,000 iterations, using a mammalian supertree [72] and either randomly sampled host habitat dendrograms (coloured boxes) or host diet niche dendrograms (grey boxes) in each iteration. Boxplots show differential medians (lines within boxes), and 2.5% and 97.5% quartiles (hinges) for individual parasites. Whiskers show minimum and maximum values. Asterisks (*) indicate significant differences from 0