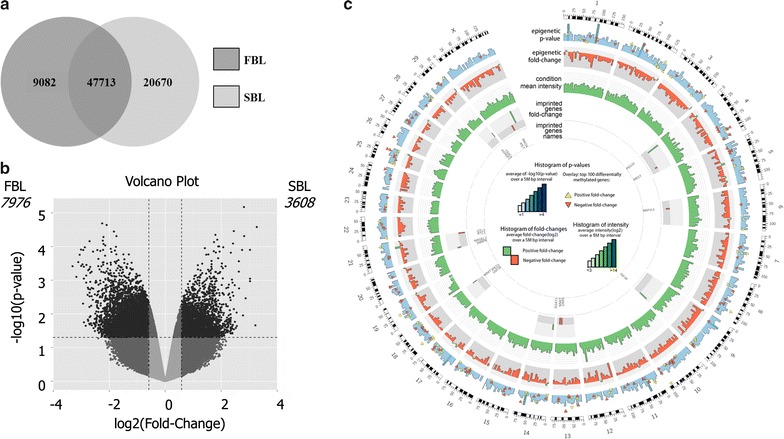
Fig. 1.

a Venn diagram representing probes expressed above background for FBL and SBL. b Volcano plot showing DMRs hypermethylated in FBL (left—7976) and hypermethylated in SBL (right—3608). Each dot represents a DMR, being positioned according to its values of log2 (fold-change) and P value. c Circular plot showing the most significant DMRs distributed among chromosomes and imprinted regions. P < 0.05 and log2 (fold-change) ≥ 1.5
