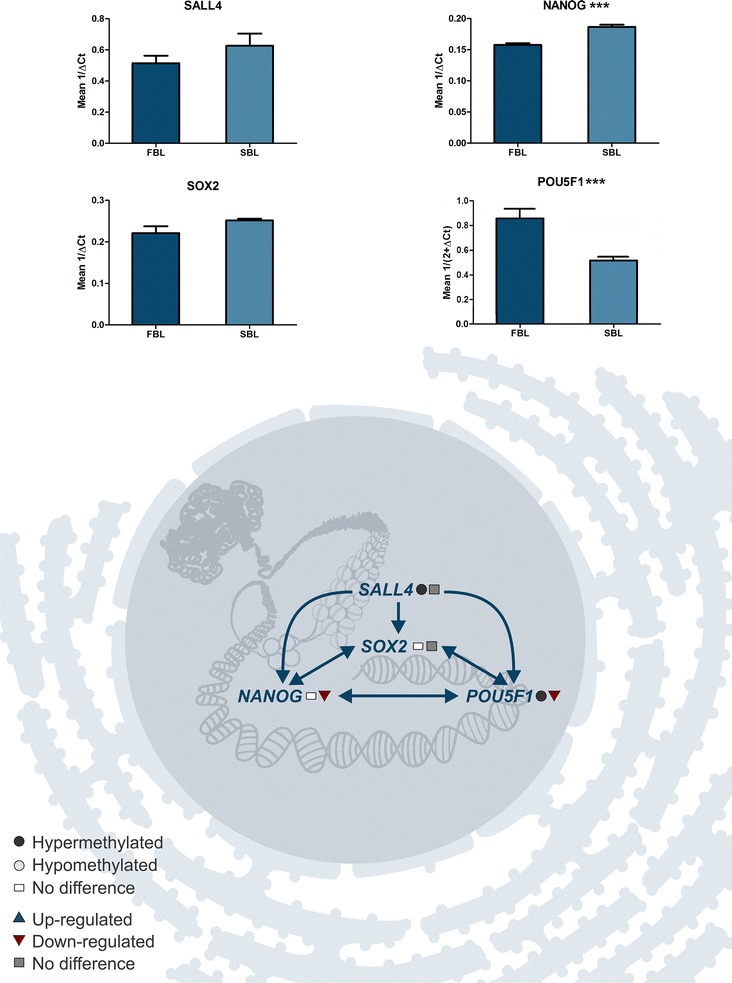
Fig. 4.

Pluripotency pathway identified with altered DNA methylation and/or genes transcripts in the FBL in comparison with SBL. Black circle represents hypermethylated genes; gray circle represents hypomethylated genes; white circle represents genes without difference in DNA methylation; blue triangle represents genes up-regulated; red triangle represents genes down-regulated; gray square represents genes without difference in RNA levels. Graphs show the difference in expression of SALL4, NANOG, SOX2, and POU5F1 for FBL and SBL (*P ≤ 0.1; **P ≤ 0.05; ***P ≤ 0.01)
