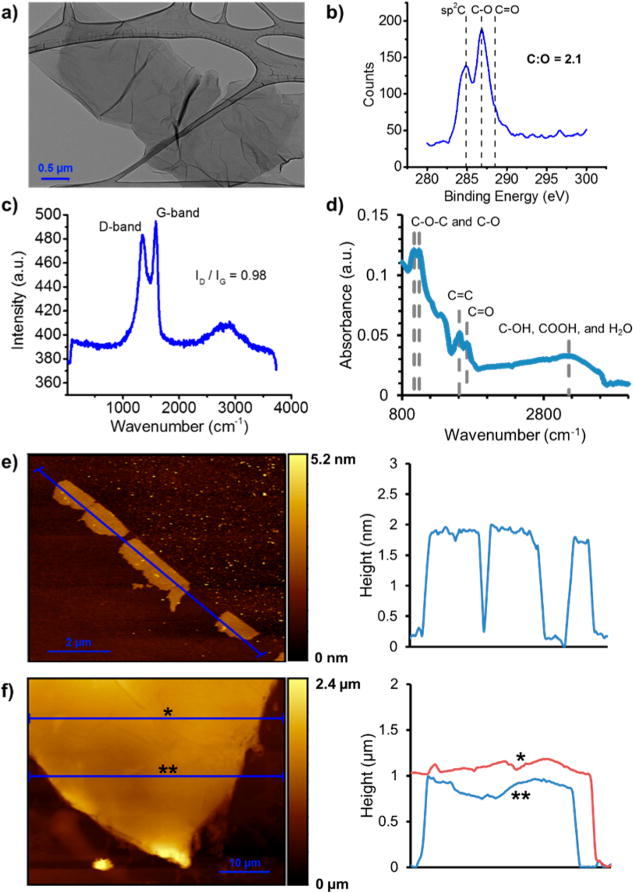
Figure 1.

Morphology of GO nanosheets and multilayer films. (a) Transmission electron micrograph (TEM) of typical nanosheet dried from the starting GO suspensions. (b) XPS C 1s characterization of the GO films, showing sp2C, C–O, and C=O peaks. Elemental analysis gave a GO C:O atomic ratio of ~2.1. (c) Raman spectrum showing a ratio of D- and G-band intensities of 0.98, consistent with XPS results. (d) FTIR spectrum showing the characteristic C–O–C, C–O, C=C, C=O, C–OH, and COOH absorbance peaks for GO. (e) AFM image and accompanying height profile of GO nanosheets drop-cast from diluted suspension onto Si. Shown are mono- or bilayer nanosheets with ~1 μm lateral dimension and 1.5–1.8 nm apparent thickness. (f) AFM micrograph and accompanying height profiles of an example ~1 μm-thick multilayer film assembled by pressure-driven filtration through a porous polycarbonate membrane, which was subsequently dissolved in methylene chloride to liberate a freestanding film.
