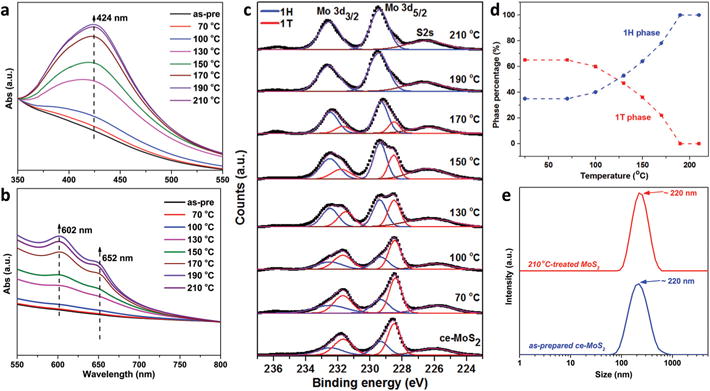
Fig. 2.

Monitoring of phase composition and nanosheet size during hydrothermal treatment with oxidation suppression. (a, b) UV-vis absorption spectra; (c) XPS spectra (Mo 3d core level peak region) for ce-MoS2 nanosheets treated hydrothermally for 2 h. In order to show relative intensity increases, the spectra in (a) and (b) are normalized using peak intensities at 350 and 800 nm, respectively. Mo 3d peaks were deconvoluted into 1T/1T′ (red) and 1H (blue) components, and the relative fractions extracted and shown in (d). (e) The hydrodynamic sizes of as-prepared ce-MoS2 and treated sample at 210 °C measured by dynamic light scattering indicate no aggregation and thus colloidal stability.
