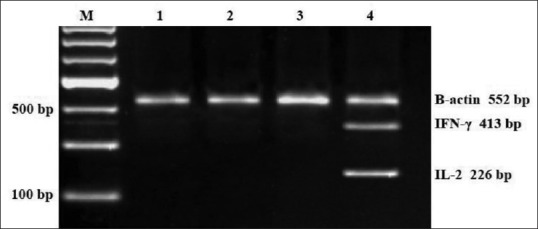
Figure 1.

Reverse transcription-polymerase chain reaction analysis of interleukin 2 and interferon-γ expression in rat peripheral blood mononuclear cell treated with immunoglobulin Y anti-Mycobacterium tuberculosis (0, 25, 50, and 100 μg/mL) for 72 h. Representative result is shown on 2% agarose gel electrophoresis displaying mRNA transcripts of interleukin 2, interferon-γ, and β-actin. Lane 1 = control (0 μg/mL immunoglobulin Y anti-Mycobacterium tuberculosis); lane 2, 3, and 4 = Immunoglobulin Y anti M. tuberculosis (25, 50, 100 μg/mL)
