
Figure 2.
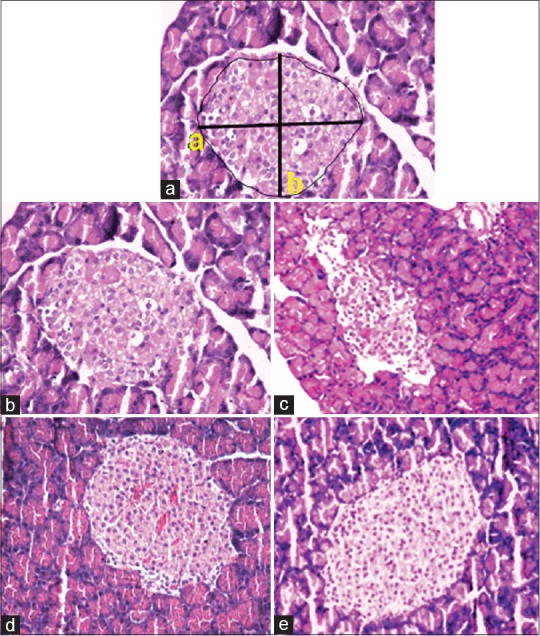
Hematoxylin and eosin-stained sections of pancreas stained after 3-week treatment. (a) Photomicrograph of a pancreatic islet used for morphometric analysis (×20). The major and minor a, bright angle diameter and the surface area of pancreas. (b) Group I islets of Langerhans with native architecture. (c) IN Group II, the islet was damaged and shrunken in size displaying degenerative changes compared to control normal rats. (d) Group III pancreatic islet displaying architecture similar to normal control rat islet. (e) Group IV islet architecture similar to normal control rat islet