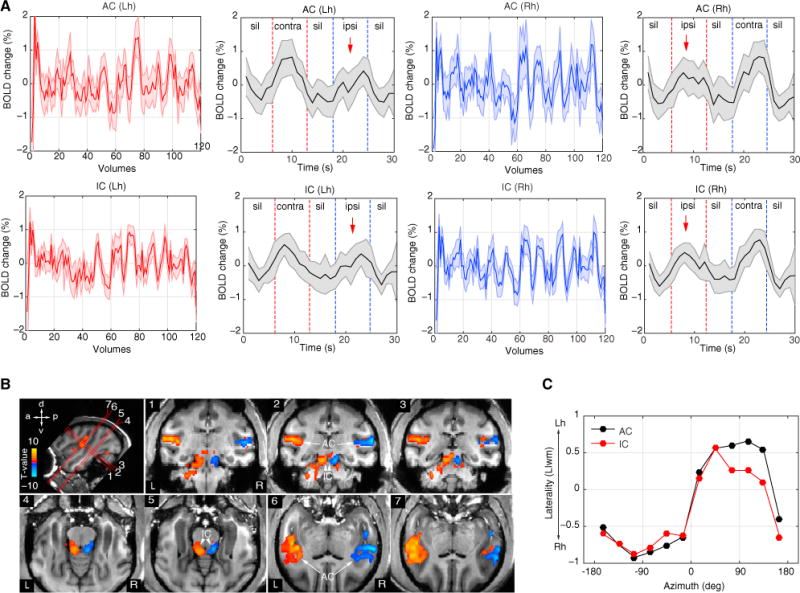
Figure 5. Cortical and Subcortical Hemifield Tuning in the Awake Monkey.

(A) Example time courses and average response (mean ± SEM) of auditory cortex (AC) and inferior colliculi (IC) in each hemisphere (red, left hemisphere; blue, right hemisphere). Red dashed lines indicate duration periods of sounds presented in the right hemifield and blue dashed duration periods of sounds presented in the left hemifield. Notice the amplitude suppression for sound sources on the ipsilateral side (red arrows).
(B) Contrast t-maps (q FDR < 0.05, p < 10−3, cluster size > 10 voxels, t value range ± 7.8) between all left and all right spatial sectors in awake monkey M3 (see also Figure S5 for M4). Top left image illustrates oblique slice orientations and planes (numbered 1–7) cutting through AC and IC. Voxels preferring the left hemifield sectors were mapped as negative (blue-to-cyan) while voxels preferring the right hemifield sectors were mapped as positive (red-to-yellow).
(C) Laterality index (LIwm) curves for AC and IC of monkey M3. Lh, left hemisphere; Rh, right hemisphere; contra, contralateral; ipsi, ipsilateral; sil, silence.
