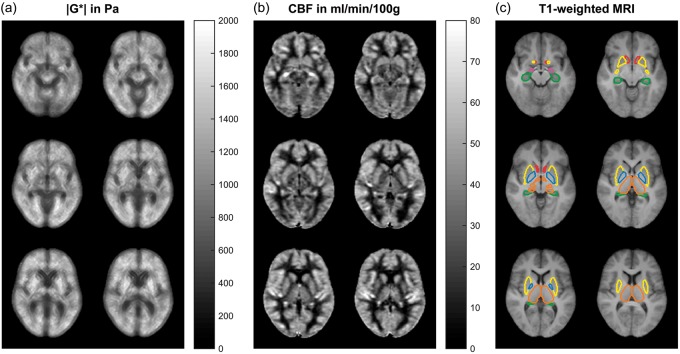
Figure 2.
Six slices of the three-dimensional |G*| map (a) and CBF map (b) averaged over 14 volunteers and corresponding T1-weighted anatomical scans with the six analyzed DGM regions (c). Note that apparently high stiffness values in putamen (yellow) are associated with relatively high CBF values. Color codes correspond to Figure 1.

