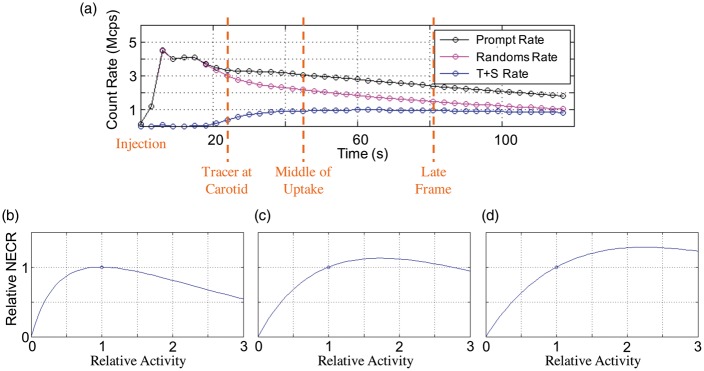
Figure 1.
(a) PET count rates versus time. Corresponding AS-NECR curves for three different PET frames: (b) Tracer at carotid, peak AIF; (c) Middle of uptake; (d) Later time frame. This example shows a well-optimized injection level to maximize peak AIF, as the peak relative NECR in (b) is very close to a relative activity of 1 (the actual injection level). As expected, later PET frames do not achieve maximum AS-NECR because activity has decreased due to isotope decay.

