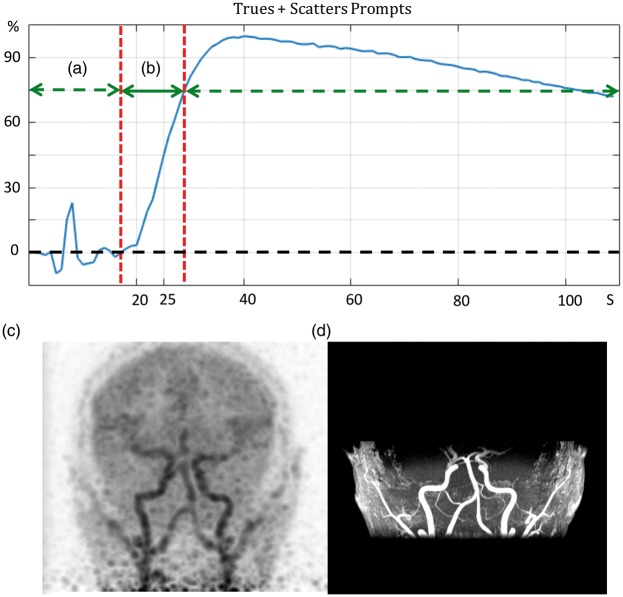
Figure 2.
The time interval (a) is from the injection time until the tracer reaches the arterial phase. The time interval (b) is between the arrival of tracer to the point when it enters the brain parenchyma. (c) shows the maximum-intensity projection (MIP) of PET images (coronal view), reconstructed over the 12-second time frame shown in (b), which constitutes a PET angiogram (PETA). (d) shows the coronal MIP of the MR angiogram images acquired simultaneously with the PET acquisition.

