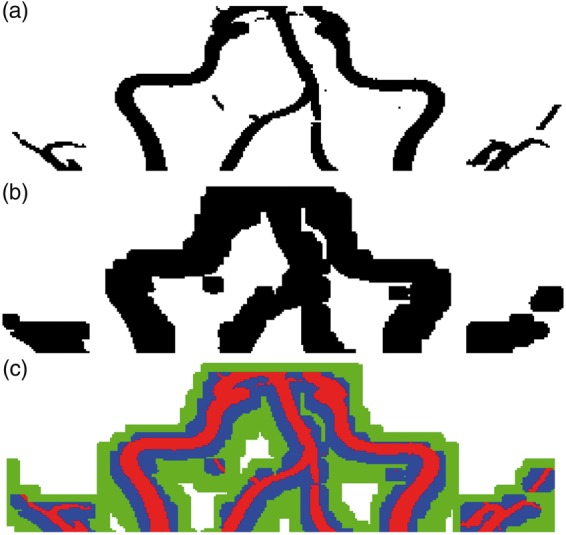
Figure 3.

(a) and (b) shows the MRA and PETA masks of carotid artery in the cervical region, respectively. (c) shows the extent of the spill-over by overlaying the MRA mask (shown in red) and PETA mask (shown in blue). The mask used to estimate the spill-in is shown in green.
