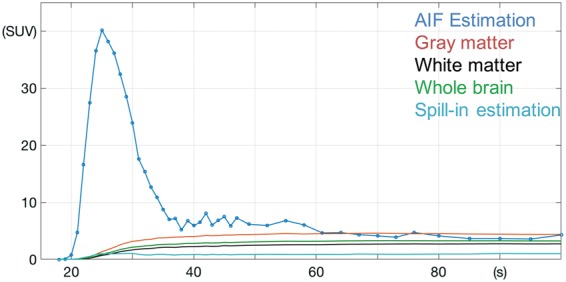
Figure 4.

AIF estimated by dividing total PET counts for each time point over the PETA mask by the arterial volume defined by the MRA mask. The average gray matter, white matter, and whole-brain activities are shown. The estimated spill-in activity, calculated by the mask shown in green in Figure 3(c) is also shown.
