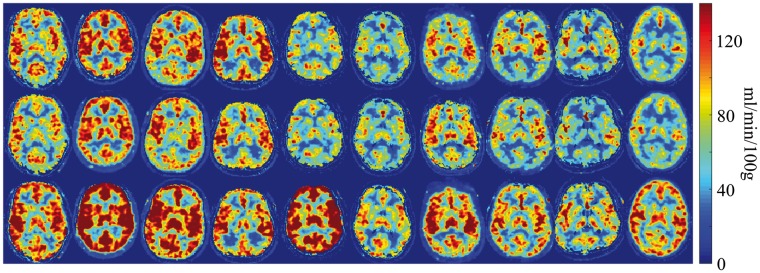
Figure 6.
CBF measurement of one slice per subject before and after acetazolamide injection. The top two rows show the CBF measurement of 1st run and 2nd run before acetazolamide administration and the bottom row shows the same measurement after the administration of 1 g of acetazolamide for each subject.

