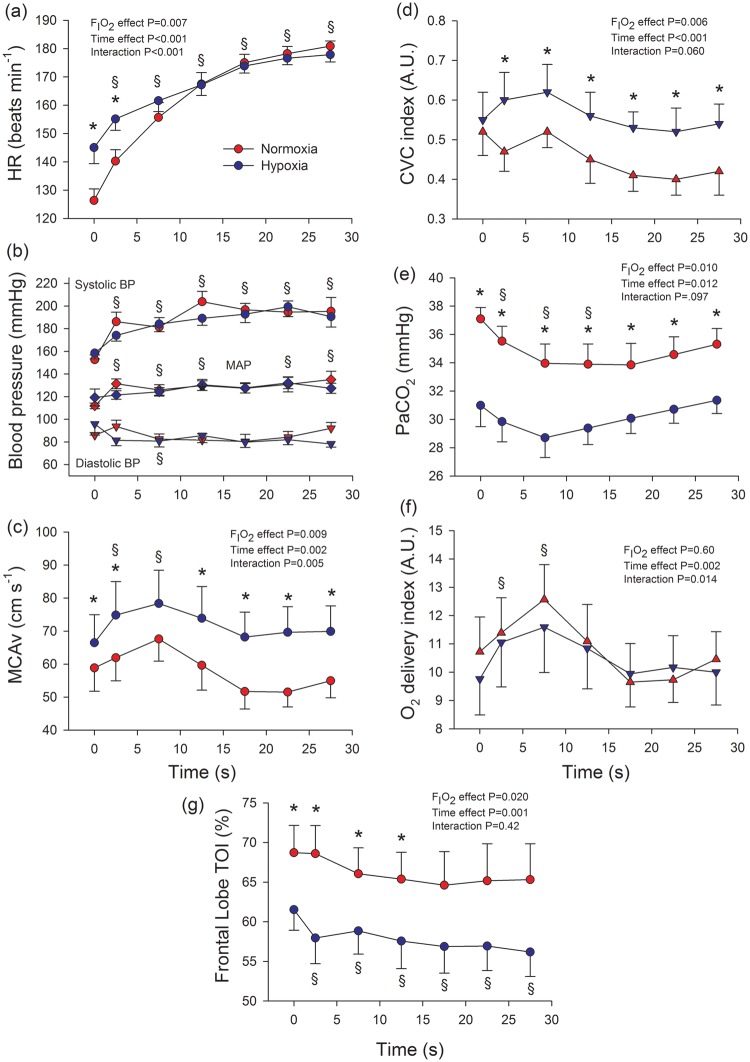
Figure 5.
Haemodynamic and cerebral blood flow responses to sprint exercise in normoxia (red circles) and severe acute hypoxia (blue circles; PIO2 = 73 mmHg; study II). (a) heart rate (HR), n = 9; (b) blood pressures, n = 9; (c) middle-cerebral artery mean velocity (MCAvmean), n = 8; (d) cerebrovascular conductance (CVC) index, calculated as the quotient MCAv/MAP, n = 8; (e) arterial partial pressure of carbon dioxide (PaCO2), n = 9; (f) Oxygen delivery index, calculated as the product of arterial oxygen content (CaO2) × MCAv, n = 8; (g) frontal lobe tissue oxygenation index (TOI), n = 9.
BP: blood pressure; MAP: mean arterial pressure. During exercise the Doppler signal was lost in three subjects. *P < 0.05 normoxia versus hypoxia, at the same time point; §P < 0.05 time effect compared to immediately before the start of the sprint; the error bars represent the standard error of the mean.

