Figure 2.
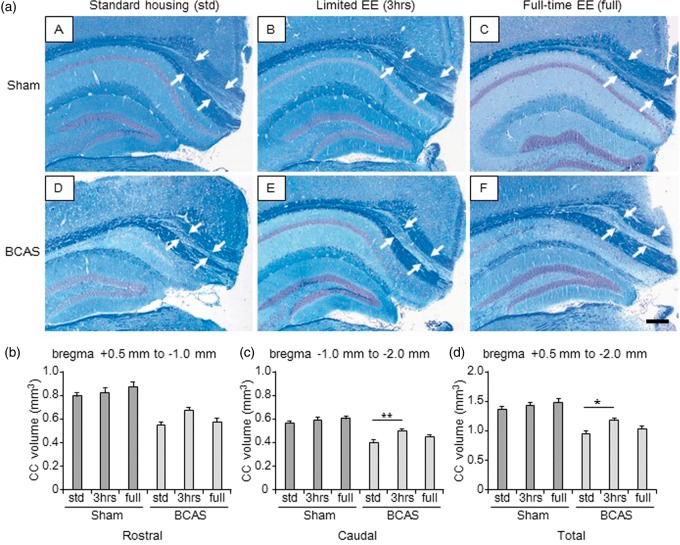
Volume of the corpus callosum (CC) (a) (A to F), LFB + CFV stained sections from block 3 (coronal level of bregma − 2.0 mm) in each group. a(A), sham-std; a (B), sham-3 h; a (C), sham-full; a (D), BCAS-std; a (E), BCAS-3 h; a (F), BCAS-full. Scale bar represents 200 µm. Arrows indicate the peripheral edge of the CC. (b to d), Histograms showing CC volume of different levels from rostral (b), caudal side (c) as well as total CC volume (d). All BCAS-std and BCAS-full subgroups showed smaller CC volume compared with all sham subgroups (P < 0.01) (b to d). BCAS-3 h showed larger total CC volume compared with BCAS-std (**P < 0.01) (c) (*P < 0.05) (d). Lack of differences were apparent between BCAS-std and BCAS-full (b to d) or between sham-std and BCAS-3 h (b to d). There were no differences between the sham subgroups (b to d).
BCAS: bilateral common carotid artery stenosis.

