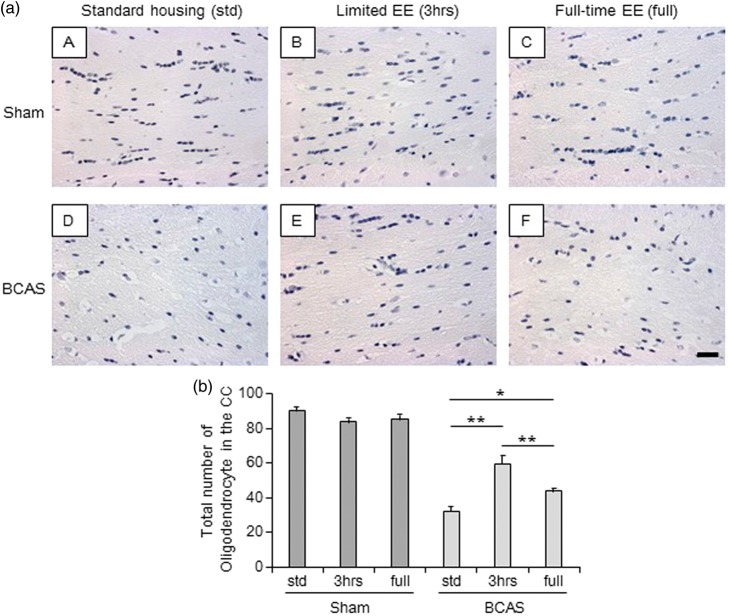
Figure 5.
Total number of oligodendrocytes in the corpus callosum (CC). (a) (A-F), Representative images of haematoxylin-stained corpus callosum (CC) in each group. a(A), sham-std; a(B), sham-3 h; a(C), sham-full; a(D), BCAS-std; a(E), BCAS-3 h; a(F), BCAS-full. Scale bar represents 25 µm. (b) Histogram showing total number of oligodendrocytes in the entire CC. BCAS-3 h showed increased number of oligodendrocytes in the entire CC compared with BCAS-std and BCAS-full (both **P < 0.01). BCAS-full showed increased number of oligodendrocytes compared with BCAS-std (*P < 0.05).

