Figure 1.
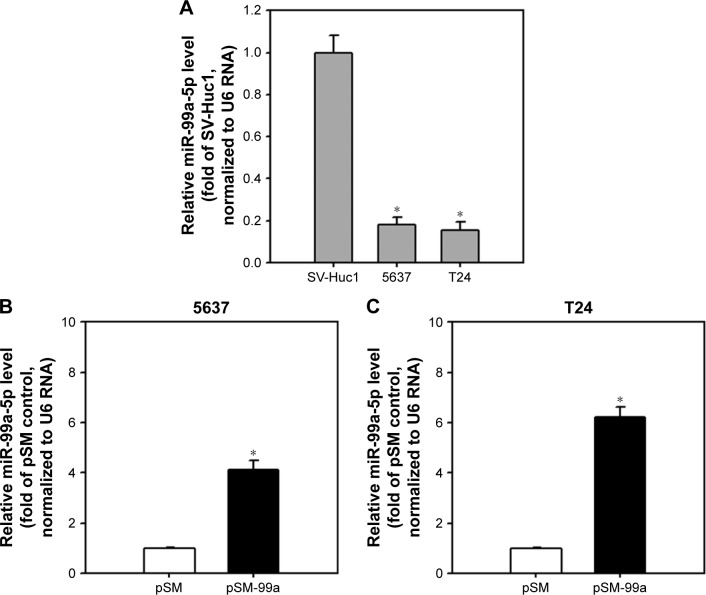
Elevation of miR-99a-5p expression levels in 5637 and T24 cells transfected with pSM-99a.
Notes: (A) miR-99a-5p was downregulated in 5637 and T24 cells. Cells at 70% confluence were collected, and the expression of miR-99a-5p was detected by miRNA QPCR. (B and C) Transfection of pSM-99a elevated the expression level of miR-99a-5p in 5637 and T24 cells. Transfected cells were selected with 200 μg/mL G418 for 24 h, while co-expressed EGFP was detectable under fluorescent microscopy. Total RNA was extracted and reverse transcribed, and the resulting first cDNA was applied to the subsequent miRNA QPCR. miR-99a-5p expression was normalized by U6 RNA. Data represent three independent experiments and are expressed as fold ± SD relative to the SV-Huc1 or vector only control (pSM). *P<0.05.
Abbreviations: miRNA, microRNA; QPCR, quantitative polymerase chain reaction; EGFP, enhanced green fluorescent protein.

