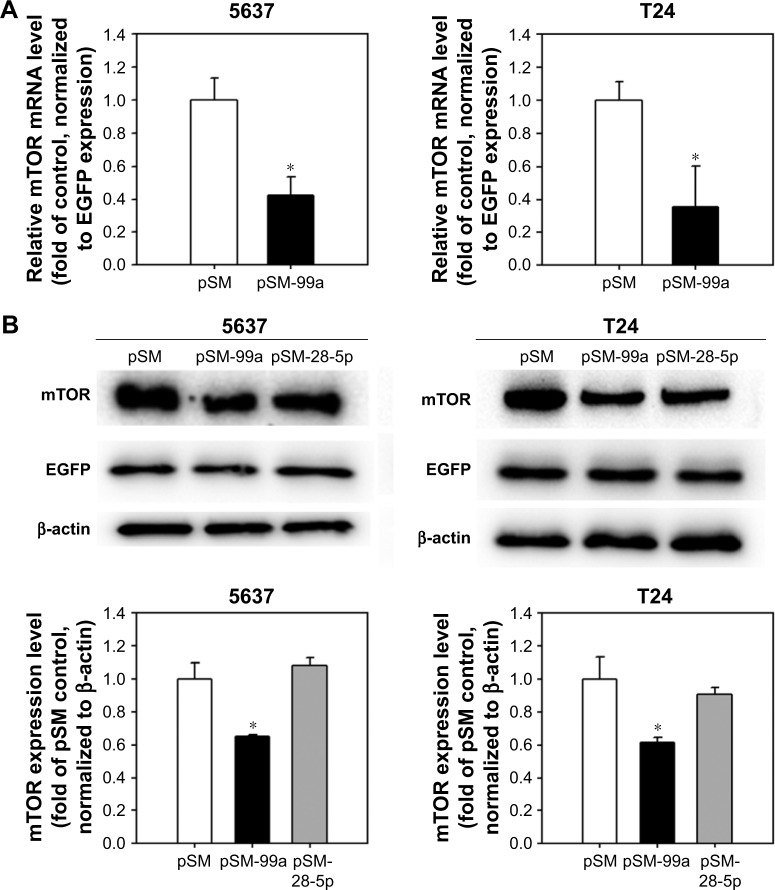
Figure 4.
miR-99a-5p inhibits mTOR expression.
Notes: (A) mTOR mRNA level in cells transfected with pSM or pSM-99a was detected by QPCR. Data represent mean ± SD values of three independent experiments, each performed in triplicate. *P<0.05. (B) Protein expression level of mTOR in cells transfected with pSM, pSM-99a or pSM-28-5p was detected by Western blot. A representative blot is shown in the upper panel. The EGFP, which co-expressed with miRNA transcripts, was detected, and β-actin was used as a loading control. The relative protein levels of mTOR in each treatment were quantified as shown in the lower panel. *P<0.05.
Abbreviations: mTOR, mammalian target of rapamycin; QPCR, quantitative polymerase chain reaction; EGFP, enhanced green fluorescent protein.

