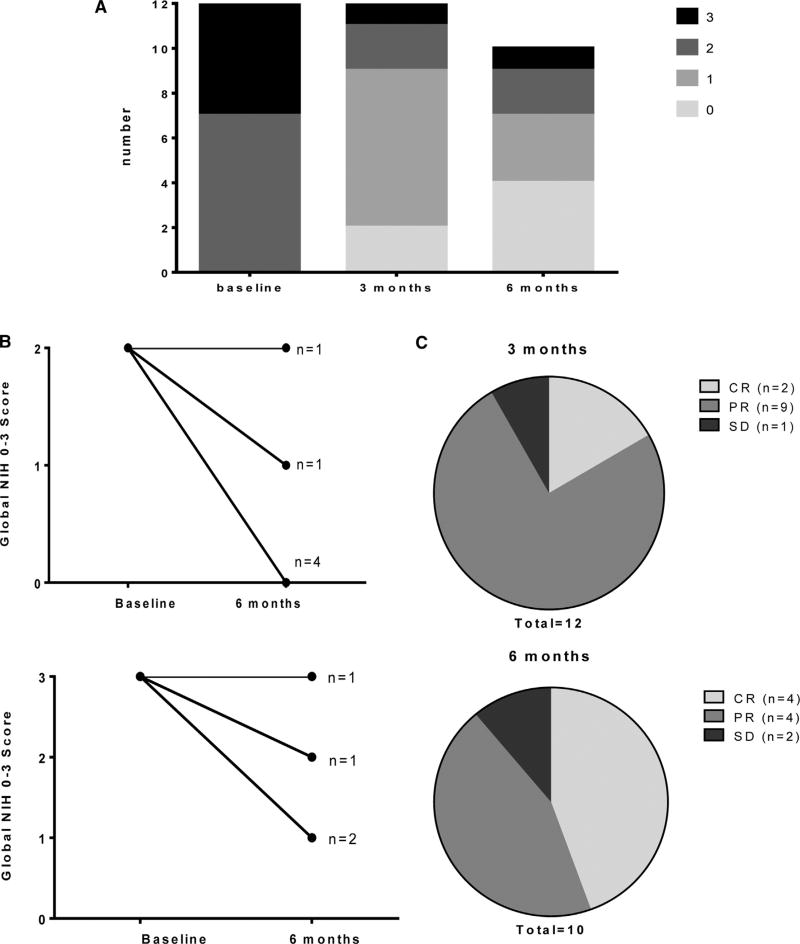
Figure 2.
Change in chronic GVHD severity. (A) Indicates distribution of NIH global 0 to 3 scores at baseline, 3 months, and 6 months. (B) Indicates change in global NIH 0 to 3 score from baseline to 6 months separately for those with initial score 2 (top) versus 3 (bottom). (C) Indicates clinician-reported overall response category at 3 months (top) and 6 (bottom) months.

