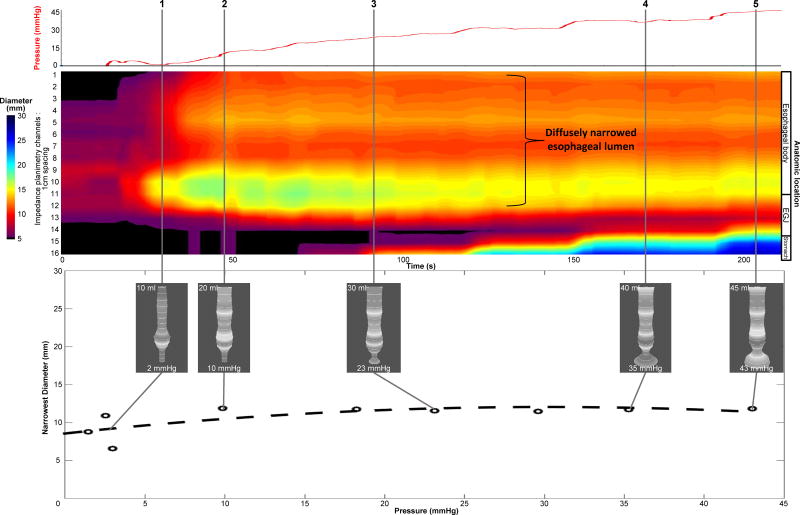
Figure 3.
Example of data acquisition and analysis in eosinophilic esophagitis using filtering schemes and post-acquisition processing to remove the effect of contraction on the assessment of distensibility plateau and restricting diameter. The maximal diameter technique was used to remove the contraction effect and thus, FLIP topography will more accurately display passive lumen geometry. The narrowest diameter and pressure values are plotted in the bottom panel with simultaneous 3-D images from real-time acquisition displayed at time points along the FLIP topography plot. The distensibility plateau is approximately 11 mm (diameter) or 95 mm2 (cross-sectional area). In addition, FLIP topography also supports that the esophagus is diffusely narrowed through the recording segment of the esophagus.
Figure used with permission from the Esophageal Center at Northwestern.

