


Figure 2.
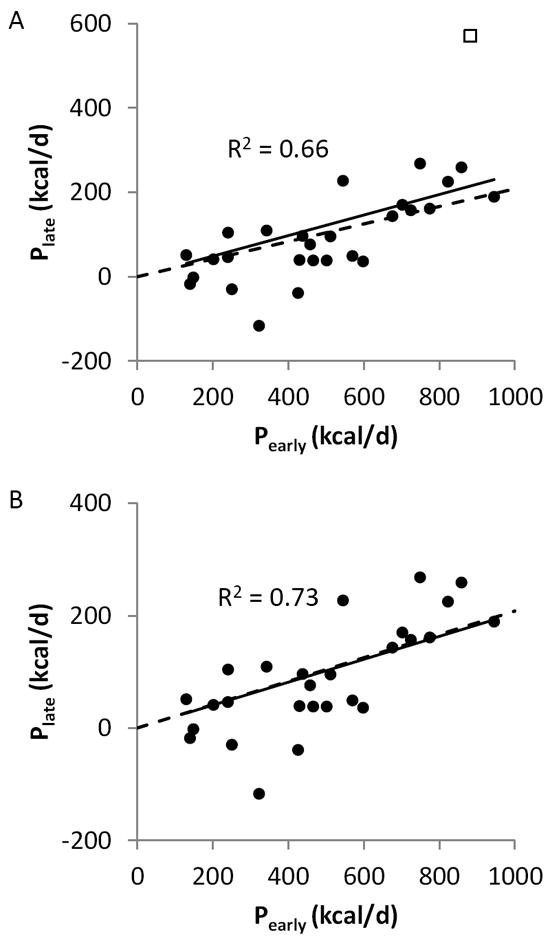
(A) A significant linear relationship was observed between the previously published parameters defining the best-fit exponential time courses characterizing early (Pearly) and late (Plate) effects of 14 different obesity pharmacotherapies on energy intake. The solid line is the best-fit linear regression line through the origin and the dashed line is the predicted linear relationship assuming that each drug has a constant effect without altering any of the pre-specified model parameters. The outlier data point indicated by the open square is for the drug combination Phentermine/Fenfluramine. (B) Removal of the Phentermine/Fenfluramine outlier results in closer agreement between the best-fit regression line (solid) with the predicted slope (dashed).