
Figure 1. Characterization and distribution of human RAG mutations.
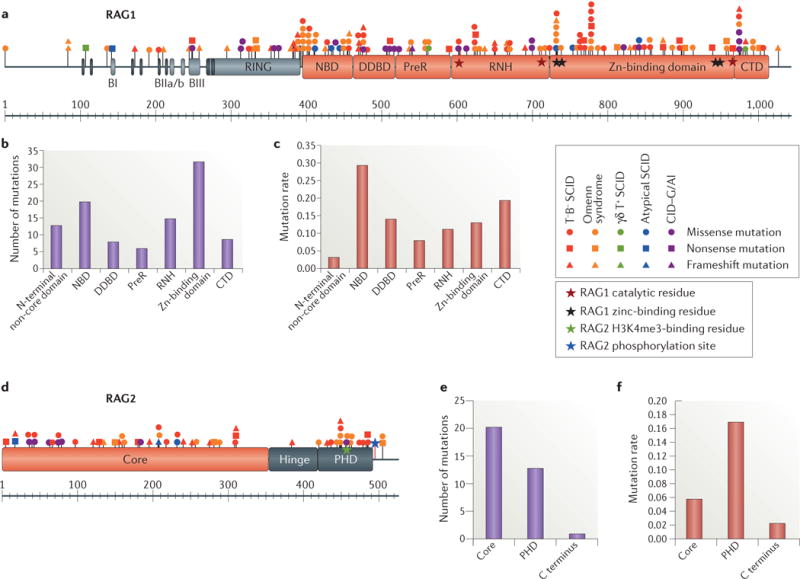
a |Schematic representation of the recombination-activating gene 1 (RAG1) protein with the various mutations colour-coded according to the clinical presentation. See Supplementary information S1 (table) for references. RAG1 catalytic and zinc-binding residues are indicated by red and black stars, respectively. b | Number of RAG1 missense mutations in the various domains. c | Frequency of RAG1 mutations calculated by dividing the number of mutations in a given region by the number of amino acids in that region. d | Schematic representation of the RAG2 protein with the various mutations colour-coded according to the clinical presentation. The trimethylated histone H3 lysine 4 (H3K4me3)-binding residue and T490 phosphorylation site of RAG2 are indicated by green and blue stars, respectively. e | Number of RAG2 missense mutations in the various domains. f | Frequency of RAG2 mutations calculated by dividing the number of mutations in a given region by the number of amino acids in that region. BI, basic I domain; BIIa/b, basic IIa/b domain; BIII, basic III domain; CTD, carboxy-terminal domain; DDBD, dimerization and DNA-binding domain; NBD, nonamer-binding domain; PHD, plant homeodomain; preR, pre-RNase H; RNH, catalytic RNase H.