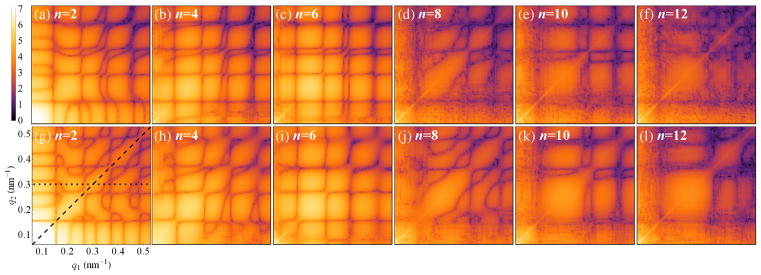
FIG. 2.
Experimental 2D correlation maps (log scale, arb. units) of the amplitudes of the FCs |C̃n(q1, q2)| for n = 2, 4, 6, 8, 10 and 12, determined for (a)–(f) RDV and (g)–(l) PR772 viruses. The legend and axes on the bottom-left map are the same for all 2D maps of the amplitudes |C̃n(q1, q2)| in this Letter. The dashed line (q1 = q2 = q) in (g) indicates a section through all 2D maps for n ≤ 12, which produce the plots in Figs. 1(c) and 1(d), while the dotted line corresponds to the plots in Figs. 1(e) and 1(f) for RDVand PR772, respectively.

