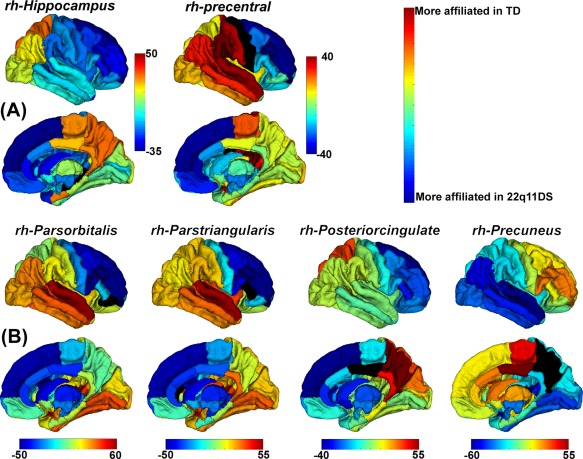
Figure 5.

Three‐dimensional surface plots (of nodal affiliations) showing differences (in %) between TD and 22q11DS Subtype 2 (Panel a) and Subtype 3 (Panel b). Warmer colors indicate that a region is more affiliated with the region‐of‐interest (black) in TD group compared with 22q11DS Subtype 2 (Panel a) or 3 (Panel b); cooler colors represent the opposite. [Color figure can be viewed at http://wileyonlinelibrary.com]
