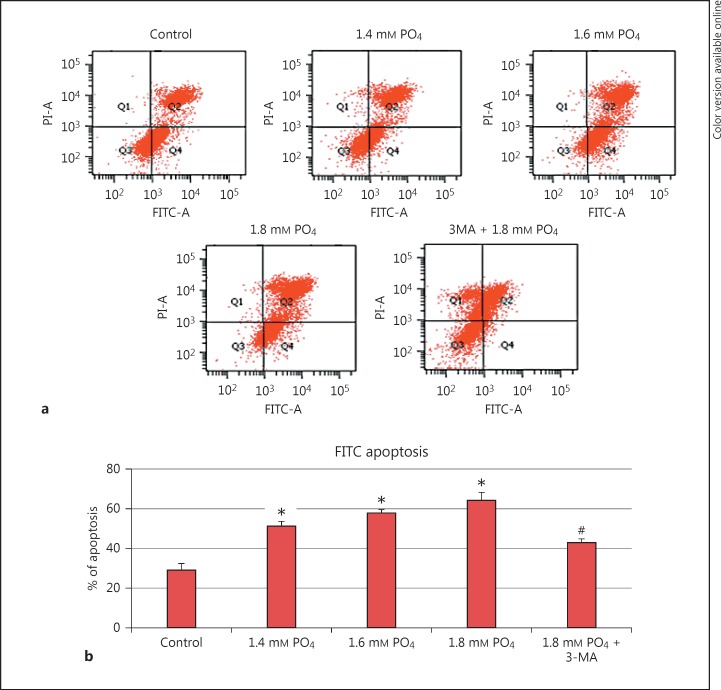
Fig. 5.
Hyperphosphate-induced cellular apoptosis. a FITC-annexin V staining for apoptosis. b Graphical representation of percent of apoptosis in phosphate treated and 3-methyladenine (3-MA) pretreated cells. * p < 0.05 denotes significant difference from control and #p < 0.05 denotes significant difference from 1.8 mm PO4.

