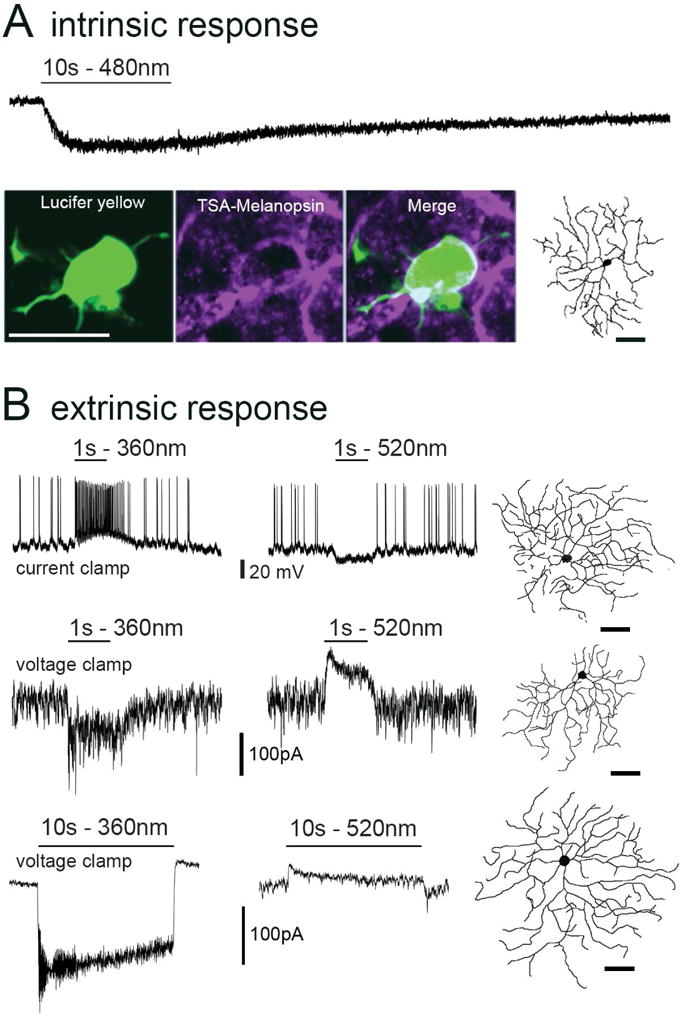
Fig. 2. Intrinsic and extrinsic photoresponses of M5 cells.

(A) Intrinsic melanopsin-based response. Whole-cell voltage-clamp recording during pharmacological blockade of retinal synapses; note the slow inward current elicited by a 10s step of full-field 480 nm light of maximum intensity. Modest melanopsin immunofluorescence (purple) is detectable in the somatic membrane of an M5 cell after tyramide signal amplification. Same cell was dye-filled with Lucifer yellow (green) during recording (scale bar: 20 μm). Reconstructed profile reveals this cell’s small bushy dendritic arbor (right; as in Fig. 1; scale bar = 50 μm). (B) Light-evoked voltage and current responses to diffuse full-field light steps of 1 s (middle traces) and 10 second (bottom traces) at two different wavelengths optimized to activate either UV-cone opsin (360 nm, left column) M-cone opsin (520 nm, right column). Stimuli in left and right columns were matched in photon flux density (1016 photons · cm−2 · s−1 for current clamp recordings; 1014 photons · cm−2 · s−1 for voltage clamp; Vhold = −64mV). Morphological reconstructions of each recorded cell are shown at right (scale bar: 50 μm).
