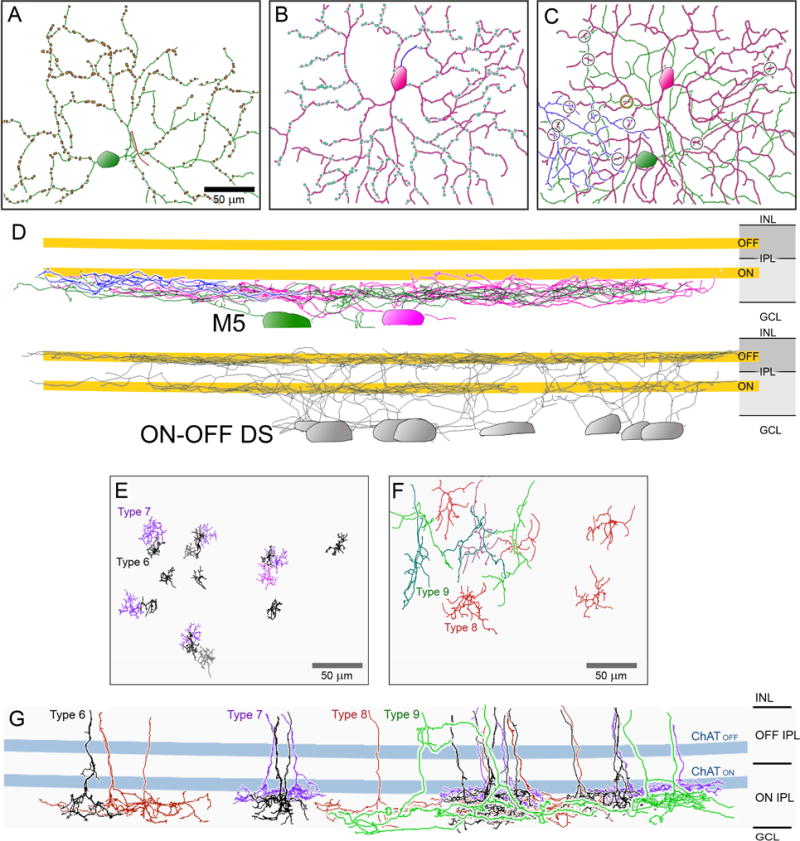
Fig. 4. Serial blockface electron-microscopic (SBEM) reconstruction of bipolar input to M5 ipRGCs.

(A–C) Dendritic architecture of three presumptive M5 cells identified by reconstruction within a single small SBEM volume (Ding et al., 2016). Cell profiles are projected onto the retinal plane. Rectangular borders mark boundary of serial EM volume. Panels A and B show two cells in isolation (#7180 and #7027, respectively). Axons are indicated by contrasting color. Dots mark sites of ribbon synaptic contact onto the reconstructed cells. (C) Overlaid profiles of three M5 cells, including the two in panels A and B, and a third, incompletely reconstructed cell (blue) whose soma lies outside the volume. Circles mark sites of direct membrane contact between processes of two of the reconstructed ganglion cells. (D) Projected side view of the same three cells. Dendritic stratification within the IPL is shown in relation to that of the ON and OFF ChAT bands (yellow) inferred from the stratification of 7 presumed ON-OFF DS cells (grey). (E–G). Architecture of cone bipolar cell Types 6 (grey/black), 7 (purple/pink), 8 (red), and 9 (green/blue) shown en face (E–F) and in side view (G). Slight variations in hues provide contrast for overlapping arbors. Scale bar = 50 μm.
