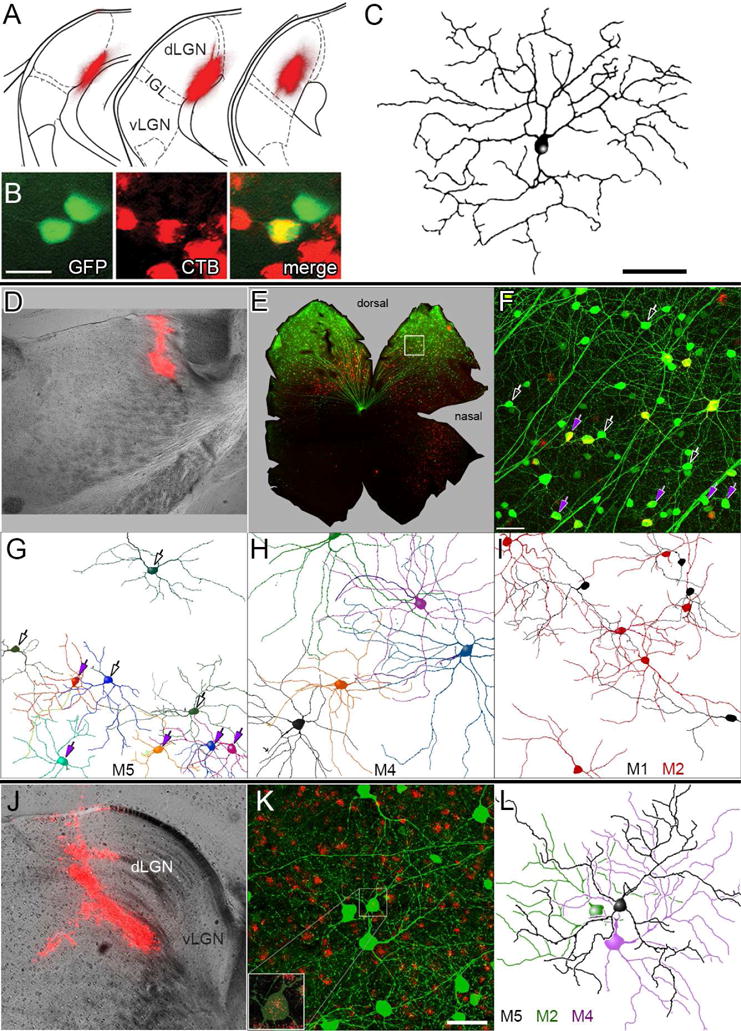
Fig. 6. Retrograde tracing shows M5 ipRGCs innervate the dLGN.

(A) Retrograde tracer deposit in the left dLGN of an Opn4Cre/+;Z/EG+/− mouse (cholera toxin β-subunit Alexa-594 conjugate). Fluorescence image (red) is superimposed on schematic dLGN coronal sections (adapted from Paxinos and Franklin, 2001; separated by 120 μm; left section most rostral). dLGN, vLGN: dorsal and ventral lateral geniculate nucleus; IGL = intergeniculate leaflet. (B, C) Retrograde labeling of an M5 ipRGC in the contralateral (right) retina (A). Green: melanopsin reporter (Cre-dependent GFP); Red: retrolabeling from dLGN. Scale bar = 20 μm. After intracellular dye-filling, the central, double-labeled ipRGC (yellow), showed characteristic M5 morphology, as documented in the reconstruction in (C). Scale bar = 50 μm. (D–I) Morphology of ipRGCs retrolabeled by rhodamine beads deposited at the rostral pole of the dLGN. ipRGCs were identified profiles partially reconstructed, by virally induced Cre-dependent GFP labeling, induced in this Opn4Cre/+ mouse by intraocular injection of an AAV2/2-CAG-FLEX-GFP virus and enhanced by anti-GFP immunofluorescence. (E) Low-magnification fluorescence photomontage of the flat-mounted left retina, contralateral to the deposit. Red: retrograde labeling; green: Cre-dependent viral GFP labeling; applies also to F. (F) Higher magnification view of region of interest (ROI) marked by the white box in E. Maximum-intensity projection of confocal optical sections spanning the inner plexiform and ganglion-cell layers. Purple arrows mark retrolabeled neurons presumed to be M5 cells, based on soma size and dendritic branching pattern and stratification (G). Other presumptive M5 cells lacking retrograde labeling are marked by hollow white arrows. Scale bar: 50 μm. (G–I) Somadendritic profiles of ipRGCs, sorted by presumed subtype and partially reconstructed from the ROI in F based on their Opn4-Cre-dependent viral labeling. Reconstructions are incomplete because only dendrites unambiguously traceable to the parent cell are included. (G) M5 cells; arrows (as in F) are purple for retrolabeled M5 cells. (H) M4 cells; all but the black cell are retrolabeled. (I) M1 and M2 cells. Four of six M2 cells are retrolabeled; among M1 cells, only that at lower left was retrolabeled. (J–L) Similar reconstruction of another presumed M5 cell, retrolabeled by the rhodamine bead injection into the dLGN shown in (J). (K) Maximum-intensity projection of Cre-dependent, GFP labeling of ipRGCs (green; enhanced by immunofluorescence) and retrograde labeling with rhodamine beads (red). Inset shows an enlarged view of the boxed M5 soma, with GFP signal dimmed to better reveal retrolabeling. (L) Partial reconstruction of somadendritic arbor of this retrolabeled presumptive M5 cell (black) and of two neighboring cells (M2 and M4; neither with clear retrolabeling). Scale bar: 50 μm.
