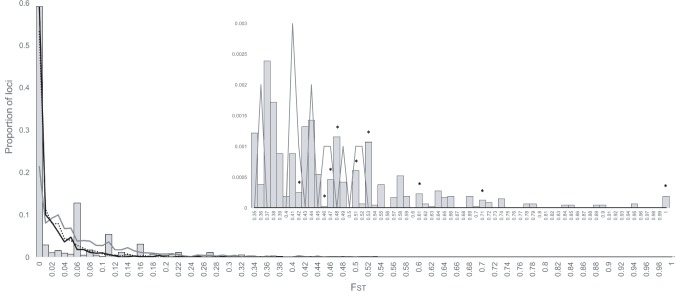
Fig. 4.
—Distribution of FST values based on MS simulations compared with empirical RAD-Seq data for divergence time of 0.5 Ma: stars = location of significant outliers, gray bars = RAD-Seq data, gray line = equal migration rate, black line = unequal migration rate (1 → 2, 10; 2 → 1, 100), dotted line = equal migration rate (1 → 2, 100; 2 → 1, 100).

