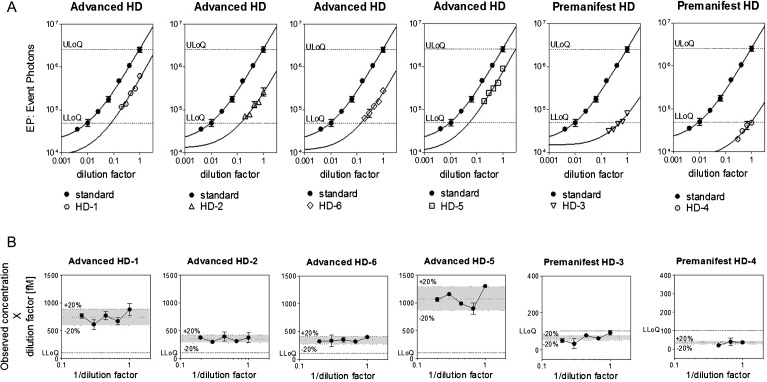
Fig.5.
Parallelism evaluation. Six CSF samples were used: four CSF from advanced HD patients and two CSF from pre-manifest HD patients. (A) N573 Q45 standard dilutions (black dots) are interpolated with a 5PL model and shown in each plot together with the signal obtained from 2B7-MW1 SMC analysis of the CSF. X and Y axes have logarithmic scales and the curves were fitted with a 5PL model. Each point is the average of 3 replicates. Bars represent standard deviation. (B) Parallelism was demonstrated by dilution linearity. Calculated mHTT concentrations (observed concentration×dilution factor) were divided by the mean of the concentrations and plotted against the inverse of the dilution factor [19]. The % RE among the dilution points was <20% for all the samples detected over the LLoQ and <30% for the two samples detected under the LLoQ.

