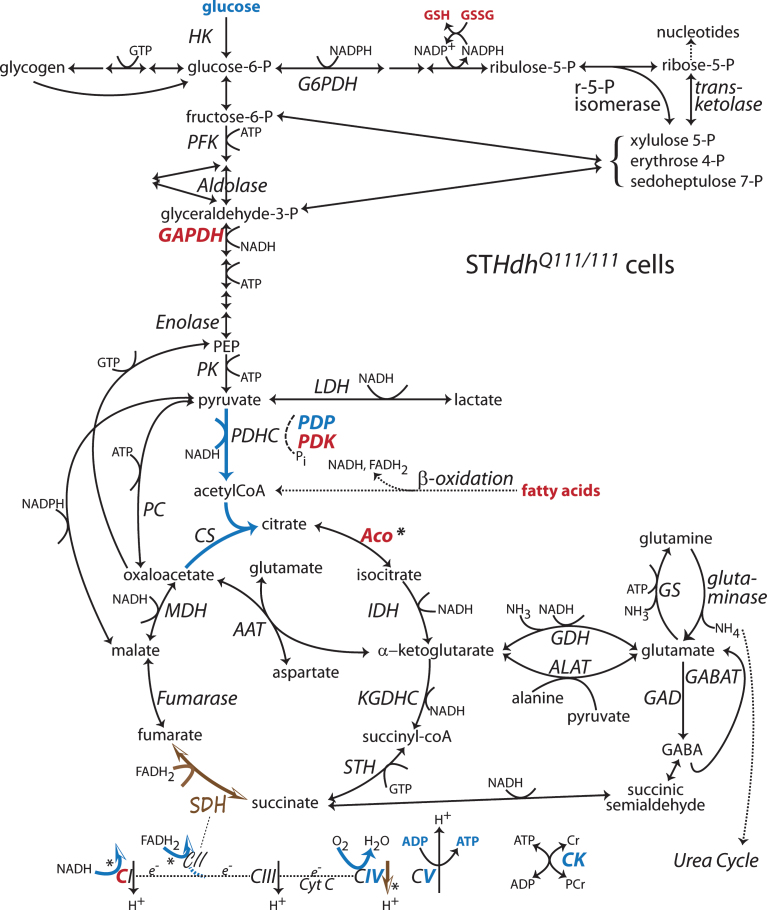
Fig.4.
Changes to metabolic pathways determined from STHdhQ111/111 cells compared to STHdhQ7/7 cells. Annotations as in Fig. 1 [63, 87, 94, 119, 120, 134, 204]. Note: Bold indicates an enzyme expression or activity has been assayed. Bold black or red indicates upregulation. Bold grey or blue indicates downregulation. Bolding of an enzyme or metabolite name indicate protein expression or concentration alterations. Partial bolding or coloring indicates differential expression changes among subunits. Bolding and/or coloring of arrows indicate activity changes. No change is indicated by a brown script font or a half open brown arrowhead. The default sans serif black font and thin black arrows with small heads indicate that no specific information is available. Combinations of symbol changes and asterisks (*) indicate conflicting reports from different laboratories.

