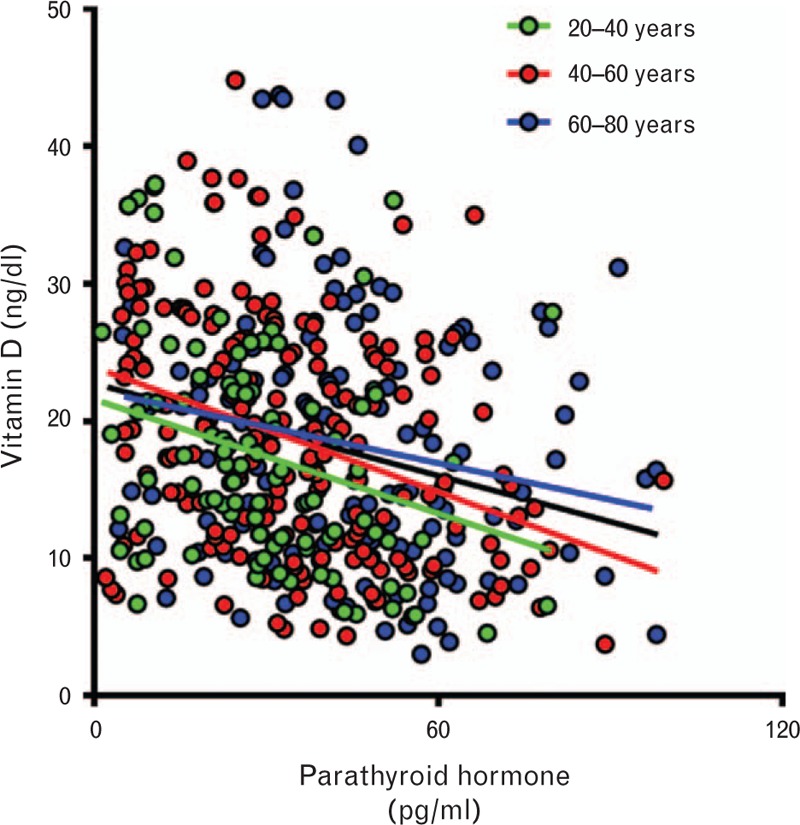
Fig. 2.

Association between vitamin D and parathyroid hormone in the overall population. There is an inverse correlation, as expected, between the two variables (black line, R2 = 0.07219, F = 28.01; P < 0.001) that is maintained through aging (20–40 years, green color: R2 = 0.08290, F = 9.311, P < 0.003; 41–60 years, red color: R2 = 0.1243, F = 26.84, P < 0.0001; 60–80 years, blue color: R2 = 0.04110, F = 6.343, P < 0.0128).
