
FIGURE 1.
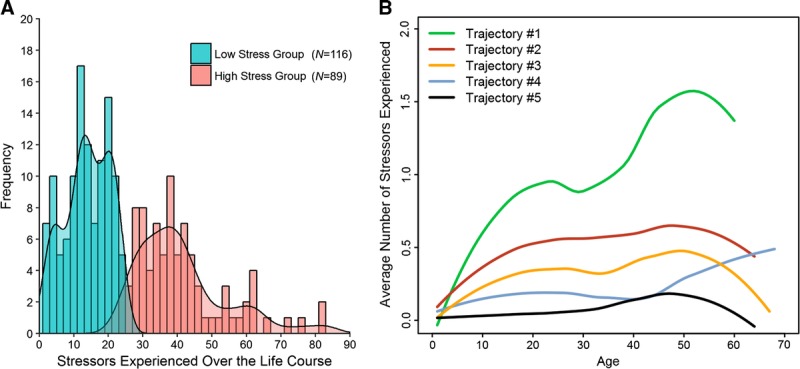
Latent structure of lifetime stressor data. (A) Latent class analysis revealed that two latent classes best fit the overall lifetime stressor count data. The low-stress group (n = 116) experienced 13.90 lifetime stressors (SD = 6.49) on average, whereas the high-stress group (n = 89) experienced 41.25 lifetime stressors (SD = 13.25) on average. (B) In turn, latent trajectory analysis revealed that five latent trajectories best fit the lifetime stressor count data over time. Trajectory #1 (n = 37) exhibited a substantial increase in stress exposure over time; Trajectory #2 (n = 70) exhibited a moderate increase in stress exposure over time; Trajectory #3 (n = 60) exhibited a mild increase in stress exposure over time, followed by a substantial decrease in later life; Trajectory #4 (n = 26) exhibited low levels of stress exposure through midlife, but an increase in stress exposure in later life; and Trajectory #5 (n = 13) exhibited very low levels of stress exposure over the entire life course (N = 205). Color image is available only in online version (www.psychosomaticmedicine.org).