
Figure 3.
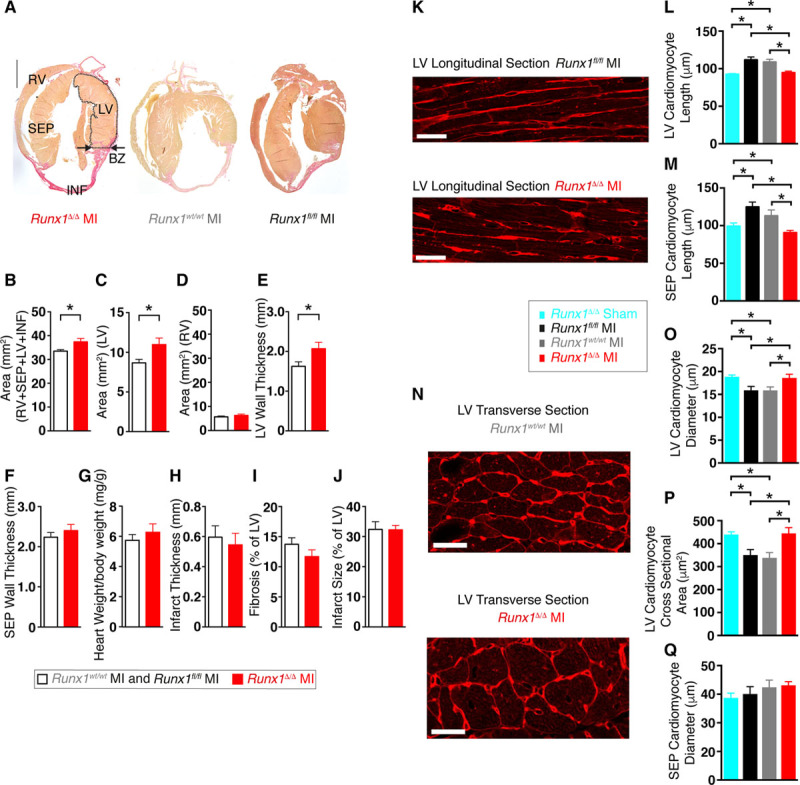
Runx1Δ/Δ mice cardiac structure 8 weeks after myocardial infarction (MI). A, Picrosirius Red–stained hearts. Scale, 1 mm. BZ indicates border zone; INF, infarct; LV, left ventricle; RV, right ventricle; and SEP, septum. Mean (B) area of whole heart (all regions), (C) LV, (D) RV, and (E) LV wall thickness at BZ region; (F) septum wall thickness at BZ region level; (G) ratio of heart weight to body weight; (H) infarct thickness; (I) LV fibrosis; and (J) infarct size (Runx1fl/fl MI and Runx1wt/wt MI combined [n=12], Runx1Δ/Δ MI [n=5]). *P<0.05, Student t test. K, Wheat germ agglutinin (WGA) staining of LV cardiomyocytes (longitudinal) of Runx1fl/fl MI (top) and Runx1Δ/Δ (bottom) after MI (scale bar, 25 mm). L, Mean LV cardiomyocyte length (Runx1Δ/Δ sham [n=55 cardiomyocytes, n=3 hearts], Runx1fl/fl MI [n=122 cardiomyocytes, n=6 hearts], Runx1wt/wt MI [n=109 cardiomyocytes, n=6 hearts], Runx1Δ/Δ MI [n=102 cardiomyocytes, n=6 hearts]). *P<0.05, linear mixed modeling. M, Mean SEP cardiomyocyte length (Runx1Δ/Δ sham [n=29 cardiomyocytes, n=3 hearts], Runx1fl/fl MI [n=82 cardiomyocytes, n=6 hearts], Runx1wt/wt MI [n=84 cardiomyocytes, n=6 hearts], Runx1Δ/Δ MI [n=64 cardiomyocytes, n=6 hearts]). N, WGA staining of LV cardiomyocytes (transverse) of Runx1wt/wt MI (left) and Runx1Δ/Δ MI (right; scale bar, 25 mm). O, Mean LV cardiomyocyte diameter (Runx1Δ/Δ sham [n=449 cardiomyocytes, n=3 hearts], Runx1fl/fl MI [n=811 cardiomyocytes, n=6 hearts], Runx1wt/wt MI [n=897 cardiomyocytes, n=6 hearts], Runx1Δ/Δ MI [n=878 cardiomyocytes, n=6 hearts]). P, Mean LV cardiomyocyte cross-sectional area (Runx1Δ/Δ sham [n=403 cardiomyocytes, n=3 hearts], Runx1fl/fl MI [n=714 cardiomyocytes, n=6 hearts], Runx1wt/wt MI [n=785 cardiomyocytes, n=6 hearts], Runx1Δ/Δ MI [n=699 cardiomyocytes, n=6 hearts]). Q, Mean SEP cardiomyocyte diameter (Runx1Δ/Δ sham [n=238 cardiomyocytes, n=3 hearts], Runx1fl/fl MI [n=465 cardiomyocytes, n=6 hearts], Runx1wt/wt MI [n=454 cardiomyocytes, n=6 hearts], Runx1Δ/Δ MI [n=452 cardiomyocytes, n=6 hearts]). *P<0.05, linear mixed modeling.