
Figure 3.
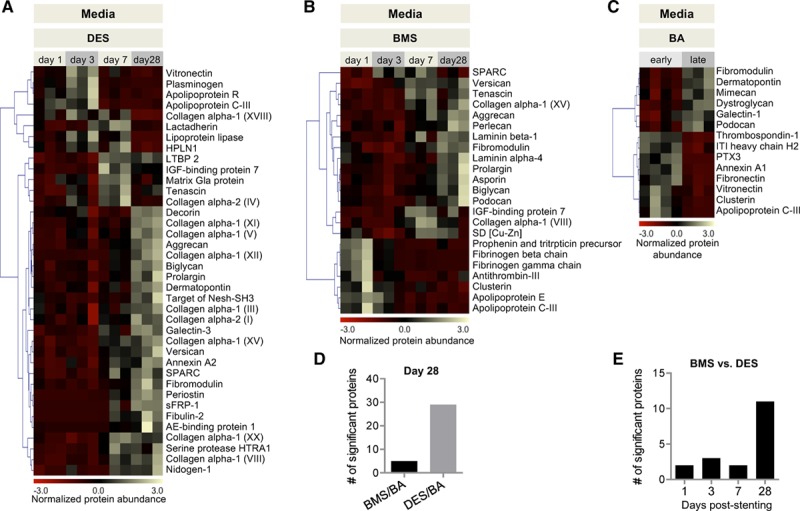
ECM remodeling in the media. A through C, Heat maps of ECM proteins with differential abundance at different time points. BMS/DES: n=3 per time point. P<0.05 (1-way ANOVA). BA: n=3–4 per group. P<0.05 (t test with unequal variance). D, Number of significant protein changes in BA late in comparison with BMS and DES at day 28. E, Number of proteins with differential abundance between DES versus BMS at day 1, 3, 7, and 28 post–stent implantation. AE indicates adipocyte enhancer; BA, balloon angioplasty; BMS, bare-metal stent; DES, drug-eluting stent; ECM, extracellular matrix; IGF, insulin-like growth factor; ITI heavy chain H2, interalpha-trypsin inhibitor heavy chain H2; LTBP2, latent-transforming growth factor β-binding protein 2; PTX3, pentraxin-related protein PTX3; SD, superoxide dismutase; and sFRP-1, secreted frizzled-related protein 1.