
Figure 4.
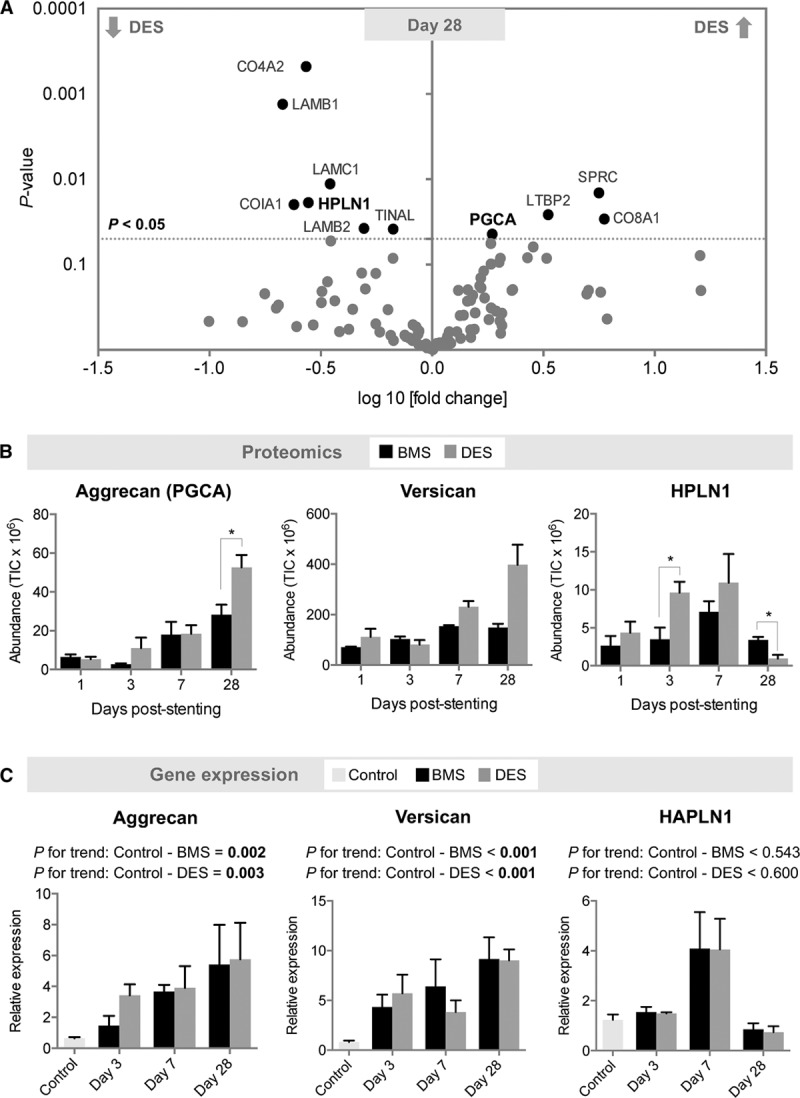
ECM composition in DES and BMS in the media. A, Volcano plot of differentially expressed proteins between DES and BMS at day 28. n=3 per group (t test with unequal variance). B, Changes in aggrecan, versican, and HPLN1 protein abundance at day 1, 3, 7, and 28 post–stent implantation. n=3 per group. *P<0.05 (t test with unequal variance). C, Corresponding gene expression in stented (n=3 per time point) and control unstented coronary arteries (n=6). Gene expression values were normalized to unstented control arteries. Linear regression analysis for P value for trend. BMS indicates bare-metal stent; DES, drug-eluting stent; ECM, extracellular matrix; HAPLN1, gene name for hyaluronan and proteoglycan link protein 1; HPLN1, hyaluronan and proteoglycan link protein 1; and PGCA, aggrecan; and TIC, total ion current.