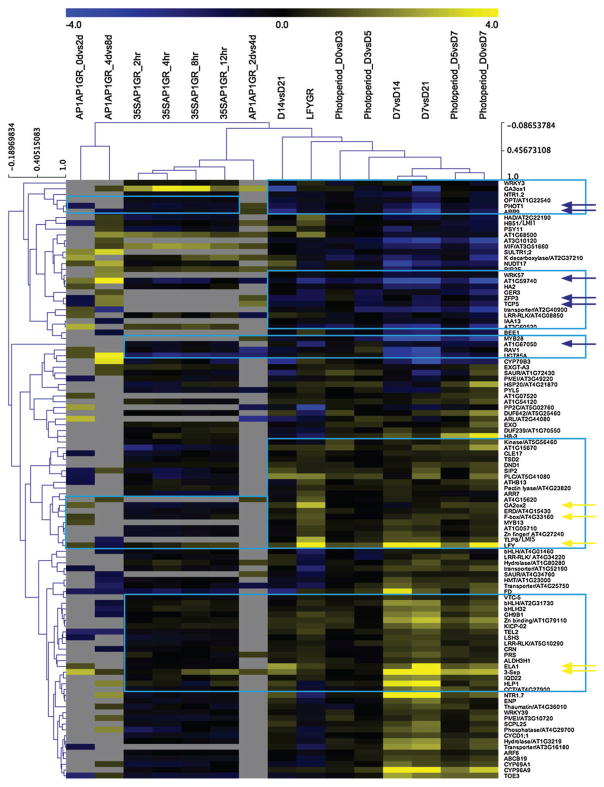
Fig. 3.
Clustering of direct AP1 and LFY targets with a likely role in the meristem identity transition. (A) Hierarchical clustering of direct LFY- and AP1-regulated genes. Heatmap displays log2 fold changes of the 104 direct LFY and AP1 targets differentially expressed in LFY-GR, AP1-GR, in response to photoperiod induction and during the switch to flower formation (day 7, day 14 and day 21) based on public transcriptome datasets (Schmid et al. 2003, 2005, Kaufmann et al. 2010, Winter et al. 2011, Pajoro et al. 2014). See Table S4 for a detailed description of data sources. Blue boxes highlight genes coordinately regulated over multiple datasets. Arrows highlight high-confidence direct LFY- and AP1-regulated genes (see Figs 4 and 5 below). Blue: downregulation, Yellow: upregulation. Clustering was performed using TMEV freeware (http://www.tm4.org/) using default values.

