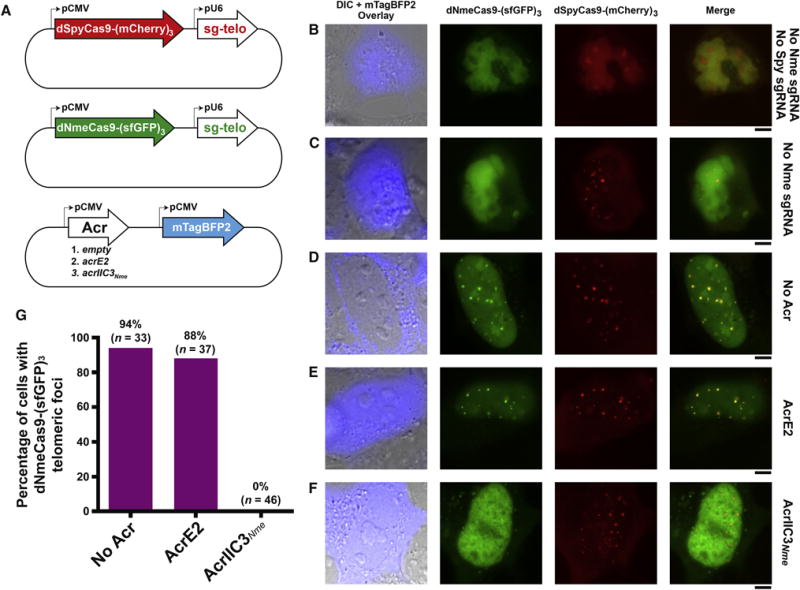
Figure 5. AcrIIC3Nme Prevents DNA Binding by NmeCas9 in Human Cells.

(A) Schematic representation of plasmids used for expression of dNmeCas9-(sfGFP)3, dSpyCas9-(mCherry)3, their respective telomeric sgRNAs, and anti-CRISPR protein. The plasmid encoding the anti-CRISPR protein is also marked with the blue fluorescent protein mTagBFP2.
(B-F) Fluorescence images of U2OS cells transiently transfected with plasmids depicted in (A). The specific version of each plasmid set (with or without sgRNAs, with or without anti-CRISPRs) is given to the right of each row. First column: differential interference contrast (DIC) and mTagBFP2 imaging, merged. Second column: dNmeCas9-(sfGFP)3. Third column: dSpyCas9-(mCherry)3. Fourth column: dNmeCas9-(sfGFP)3 and dSpyCas9-(mCherry)3, merged. Scale bars, 5 μm.
(G) Quantitation of dNmeCas9-(sfGFP)3 telomeric foci, as judged by co-localization with dSpyCas9-(mCherry)3 telomeric foci, in cells that express no anti-CRISPR, negative control anti-CRISPR (AcrE2), or AcrIIC3Nme. Foci were scored blind, i.e. without the experimenter knowing the sample identities (see STAR Methods). n represents the number of cells that were scored in each condition.
