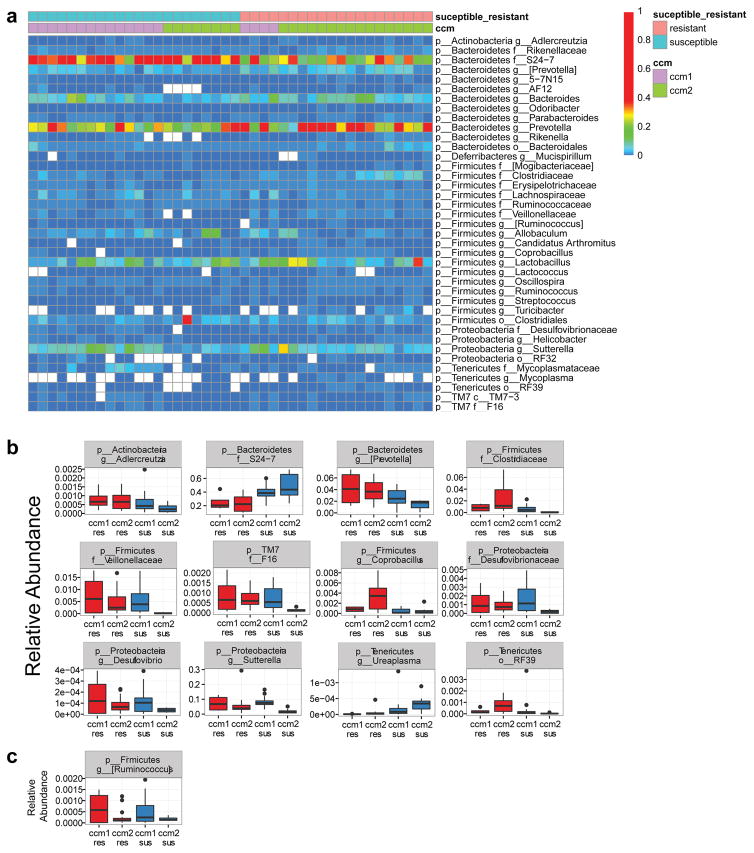
Extended Data Figure 7. 16s rRNA sequencing results from susceptible and resistant Krit1fl/fl and Ccm2fl/fl dams.
a, Heat map showing relative abundance of bacterial taxa (right) identified in susceptible (blue) and resistant (salmon) Krit1 (ccm1, purple) and Ccm2 (ccm2, green) animals (top). b, Box plots of bacterial taxa that demonstrated significant differential abundance in susceptible versus resistant animals and the relative abundance of those taxa. c, Boxplot of the Firmicutes [Ruminococcus] taxon that displayed significant differential abundance between Krit1 and Ccm2 genotypes. Note that the relative abundance of Bacteroidetes s24-7 is anywhere from 10 to 10,000-fold greater than any other taxon. Significance (p<0.05) for b and c determined by linear mixed effects modeling with Benjamini-Hochberg correction for multiple comparisons.

