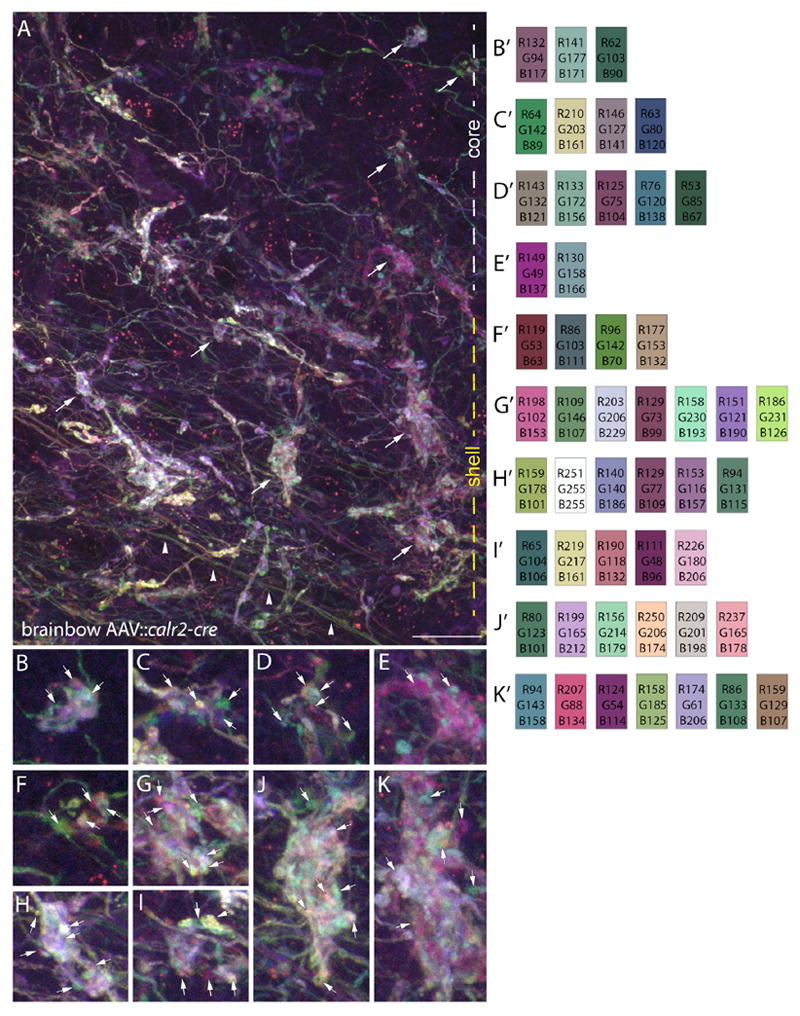
Figure 2. Clusters of Retinal Terminals in dLGN Contain Boutons from Multiple Retinal Axons.

(A) Maximum projection, confocal image of retinal axons, and terminals labeled with brainbow AAVs in the “core” and “shell” region of dLGN of P35 calb2-cre mice. White and yellow dashed lines on the right indicate the “core” and “shell” regions of dLGN in this image. Arrowheads highlight retinal axons traversing this region of dLGN.
(B–K) High-magnification images of the retinal boutons indicated by arrows in (A). B′–K′ show color analysis for terminals highlighted with arrowheads in (B)–(K). Scale bar in (A), 20 μm for (A) and 7 μm for (B)–(K).
