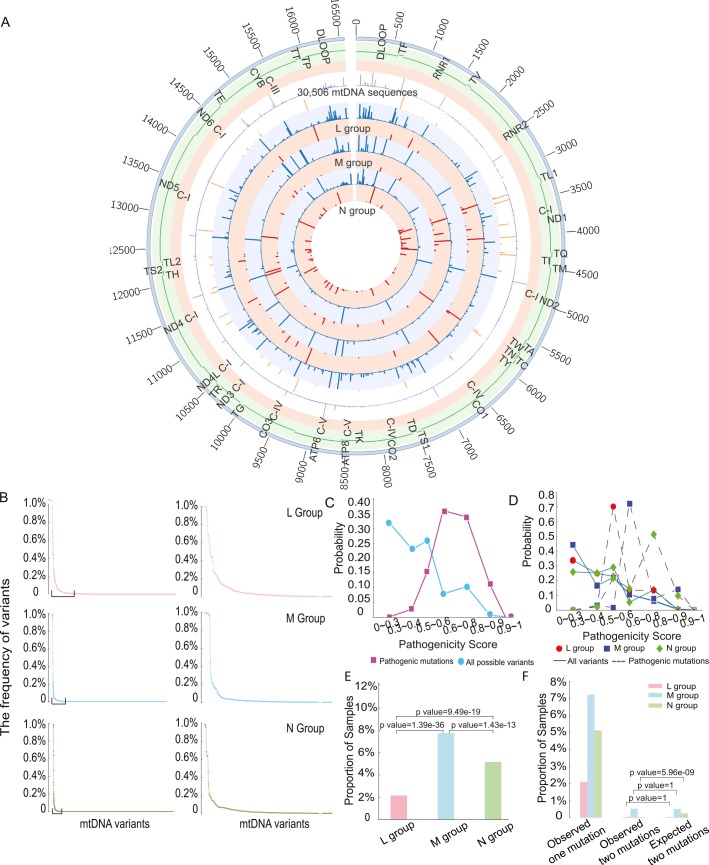
Fig 2. The distribution of variant frequency and assessing the pathogenicity score in 30,506 mtDNA sequences.
(A) Circos plot summarizing all of the genetic data in 30,506 mtDNA sequences. From outside the circle to inside: (1) mtDNA position, (2) mtDNA genes, (3) mtDNA Complex, (4) frequency of all variants in 30,506 mitochondrial sequences(range 0 to 98.70%), (5) frequency of diseases-causing mutations in 30,506 mitochondrial sequences(range 0 to 0.89%), (6) frequency of all variants in L group(range 0 to 99.45%), (7) frequency of diseases-causing mutations in L group(range 0 to 0.65%), (8) frequency of all variants in M group(range 0 to 99.60%), (9) frequency of diseases-causing mutations in M group(range 0 to 3.11%), (10) frequency of all variants in N group(range 0 to 98.60%), (11) frequency of diseases-causing mutations in N(range 0 to 1.26%), Color code for circles (4)–(11): Red—frequency of diseases-causing mutations, blue—frequency of all variants. (B) The distribution of frequency of variants in each macro-haplogroup. MtDNA variants in were ordered based on frequency from high to low. The right-hand panel highlights the variants with frequency above 0.5% in each group. (C) Probability distributions of the observed pathogenicity scores for all population variants and defined disease-causing mutations. (D) Probability distributions of the pathogenicity scores for all variants and disease-causing mutations within each macro-haplogroup. (E) Proportion of samples carrying disease-causing mutations. (F) Percentage of mtDNA sequences harboring two of more disease-causing mutations.

