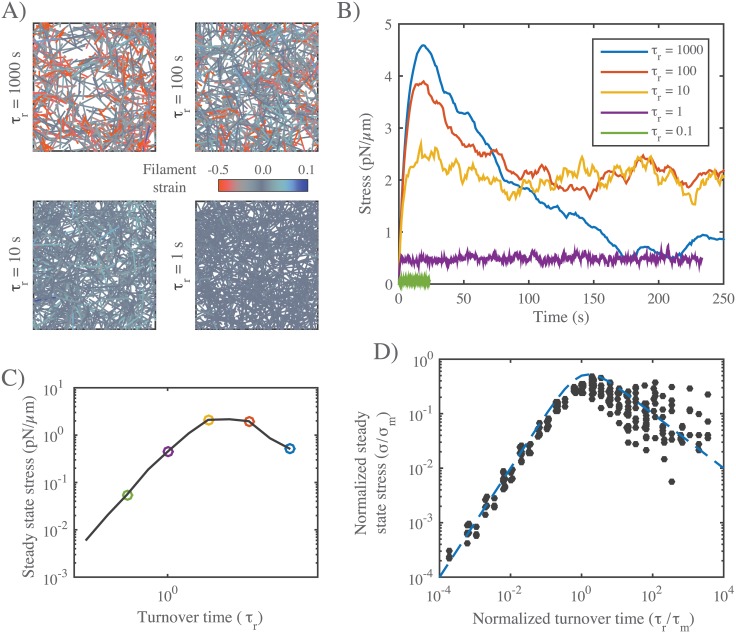
Fig 7. Filament turnover allows active networks to exert sustained stress on a fixed boundary.
A) Snapshots from simulations of active networks with fixed boundaries and different rates of filament turnover. All other parameter values are the same as in Fig 6A. Note the significant buildup of compressional strain and significant remodeling for longer, but not shorter, turnover times. B) Plots of net stress exerted by the network on its boundaries for different recycling times; for long-lived filaments, stress is built rapidly, but then dissipates. Decreasing filament lifetimes reduces stress dissipation by replacing compressed with uncompressed filaments, allowing higher levels of steady state stress; for very short lifetimes, stress is reduced, because individual filaments do not have time to build stress before turning over. C) Plots of steady state stress estimated from the simulations in B) vs. turnover time. D) Plot of normalized steady state stress vs. normalized turnover time for a wide range of network parameters and turnover times. Steady state stress is normalized by the predicted maximum stress σm achieved in the absence of filament turnover. Turnover time is normalized by the predicted time to achieve maximum stress τm, in the absence of filament turnover. Predictions for σm and τm were obtained from the phenomenological scaling relations shown in (S3B and S3C Fig). Dashed blue line indicates the approximation given in eq 10 for n = 1.

