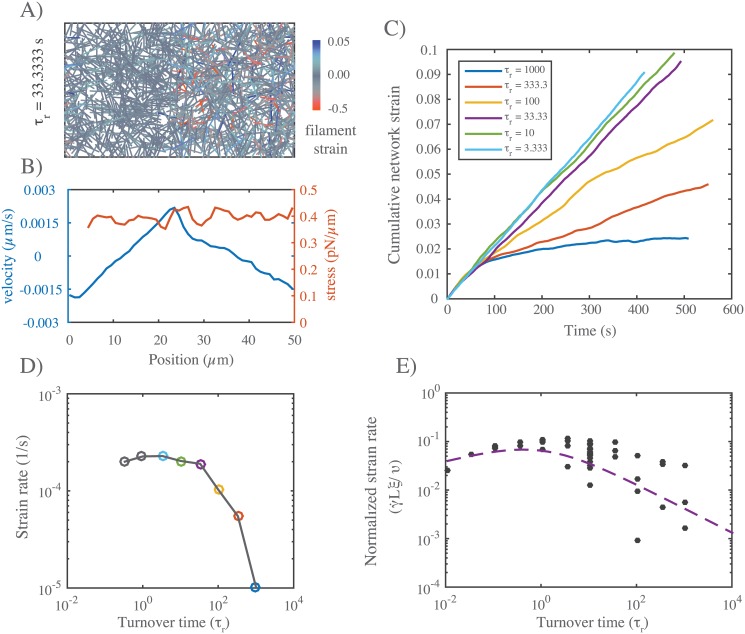
Fig 9. Filament turnover allows sustained flows in response to gradients of motor activity.
A) Snapshot from a simulation of an asymmetrically contracting network, with motor activity restricted to right half domain, and τr = 33. Network parameters are same as in Figs 6 and 7, and τm < τc. B) Plots of stress and flow velocity vs position for an analogous simulation (with τr = 10) at long times, under ∼ steady state flow. Blue indicates average filament velocity while red represents average network stress, measured as described in the main text. C) Graph of cumulative network strain (on the left half-network) vs. time for identical networks with varying turnover rates. D) Steady state strain rate on the left half-network as a function of τr, with colored points corresponding to the data from (C). E) Normalized steady state strain rate on the left half network as a function of turnover time τr. Dashed line is form of dependence predicted by the theoretical arguments shown in Fig 8. Importantly, for all parameter values, τm < τc, corresponding to the scenario in Fig 8A.

