
Fig. 5.
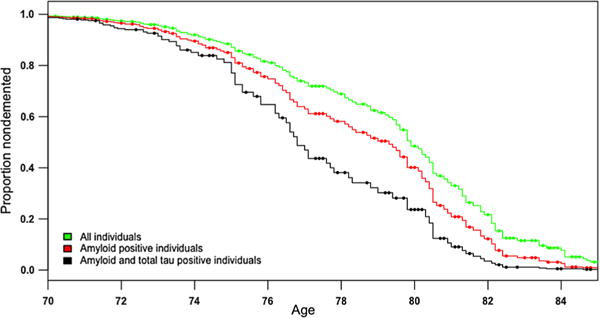
Survivor plot showing greater progression to AD dementia as a function of polygenic hazard score (PHS) for all individuals (green), individuals who were amyloid positive (red) and individuals who were both amyloid and total tau positive (black)