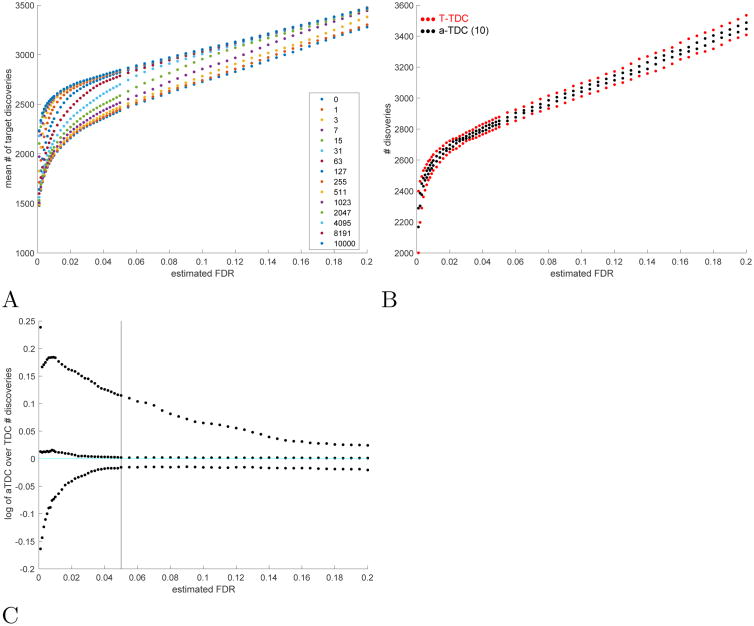
Fig. 4. Malaria data.
A Partial calibration: the mean number of target discoveries in the malaria dataset increases with the number of calibrating decoys. B a-TDC is less variable than TDC: the 0.05 and 0.95 quantiles of the number of a-TDC / TDC discoveries are compared (scores are calibrated using all 10K calibrating decoys). C Using PC a-TDC can have more power than TDC: plotted are the log of the ratios of the 0.05, 0.5 and 0.95 quantiles of the number of a-TDC (10 competing decoys) discoveries over the corresponding numbers for TDC discoveries. A-C All quantiles are taken with respect to 2000 randomly drawn sets of competing decoys, as described in Supp. Sec. 1.4.

