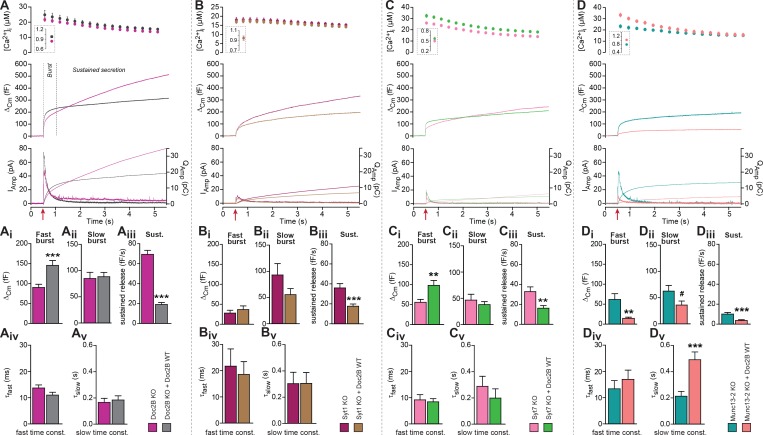
Figure 1. Doc2B requires synaptotagmin-1 and Munc13-2 to increase the Readily Releasable Pool (RRP) size.
(A) Expression of Doc2B in Doc2B knockout (KO) mouse adrenal chromaffin cells. Top panels: Intracellular [Ca2+] (mean ±SEM) after and (insert) shortly before Ca2+ uncaging (uncaging light for 1–2 ms at red arrow). Middle panel: average capacitance traces from Ca2+ uncaging experiments in Doc2B KO cells (magenta traces, n = 40 cells) and after overexpression of Doc2B WT in Doc2B KO cells (grey traces, n = 36 cells). Bottom panel: amperometric measurements (mean traces) from the same cells. Traces showing a release transient after the uncaging stimulus are the amperometric currents (left ordinate axes). Monotonically increasing traces display the time-integral of the amperometric current (i.e. the charge), scaled to the right ordinate axis. Note that the time-integrals display the same general shape as the capacitance traces, as expected. (Ai) The amplitude (mean ±SEM) of the fast burst was increased by Doc2B (***p<0.001, Mann-Whitney test), whereas (Aii) the amplitude of the slow burst component remained constant. Fast and slow burst correspond to the sizes of the RRP and the SRP, respectively. (Aiii) The rate of the near-linear sustained component (D) was strongly reduced by Doc2B (***p<0.001, Mann-Whitney test). (Aiv) The fusion time constant for the fast burst, and (Av) fusion time constant for the slow burst were unaffected by Doc2B. (B) Ca2+ uncaging experiment in syt-1 KO cells (n = 18) and syt-1 KO cells overexpressing Doc2B WT (n = 20). Panels (B–Bv) are arranged as in A. Doc2B expression led to a highly significant reduction in sustained release, but no significant changes in the fast or slow burst sizes. ***p<0.001, Mann-Whitney test. (C) Ca2+ uncaging experiment in syt-7 KO cells (n = 17) and syt-7 KO cells overexpressing Doc2B WT (n = 17). Panels (C–Cv) are arranged as in A. Doc2B expression led to a significant increase in fast burst size (**p<0.01, Mann Whitney test), and a reduction in sustained release (**p<0.01, unpaired, two-tailed Student’s t test), as in control experiments (panel A). (D) Ca2+ uncaging experiment in Munc13-2 KO cells (n = 16) and Munc13-2 KO cells overexpressing Doc2B WT (n = 18). Panels (D–Dv) are arranged as in A. All components of release were reduced by overexpression of Doc2B WT in the absence of Munc13-2 (**p<0.01, ***p<0.001, Mann Whitney test; # p=0.0575, unpaired two-tailed Student’s t-test). The time constant of the slow component was increased (***p<0.001, unpaired two-tailed Student's t-test).


