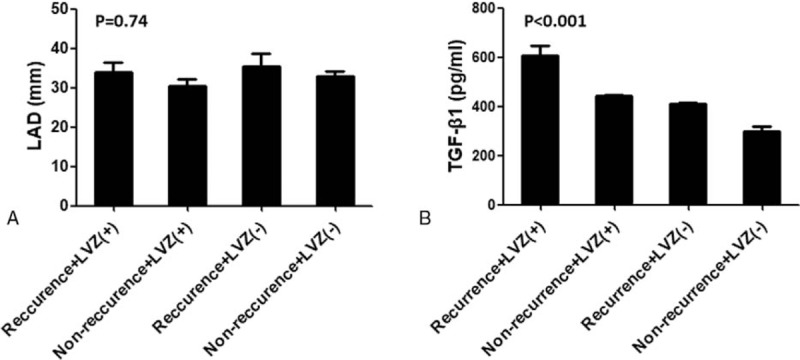
Figure 4.

left atrial diameter (A) and serum TGF-β1 concentration (B) according to the low-voltage zone (LVZ) and arrhythmia recurrence. ANOVA analysis shows significant differences in serum TGF-β1 concentration among 4 groups. LVZ (+), patient with atrial LVZ; LVZ(–),patient without atrial LVZ.
